The 1inch Network (1INCH) price reached a new yearly high on Feb. 21, but has fallen on Wednesday. However, no bearish reversal signs are in place, suggesting that the upward trend could continue.
The 1inch Network is an aggregation protocol unites decentralized finance (DeFi) protocols whose synergy enables the lowest prices and the fastest DeFi operations. A total of 274,286 1INCH tokens will be unlocked on Feb. 22. This represents 0.018% of the total supply, while 37% is still locked. Another significant unlock will occur on June 3, when roughly 250 million tokens will be unlocked. This is the largest remaining token unlock.
Possibly as a result of the token unlock, the 1inch Network price decreased sharply so far on Feb. 22 and is in the process of creating a bearish candlestick.
1inch Network (1INCH) Price Breaks out From Long-Term Resistance
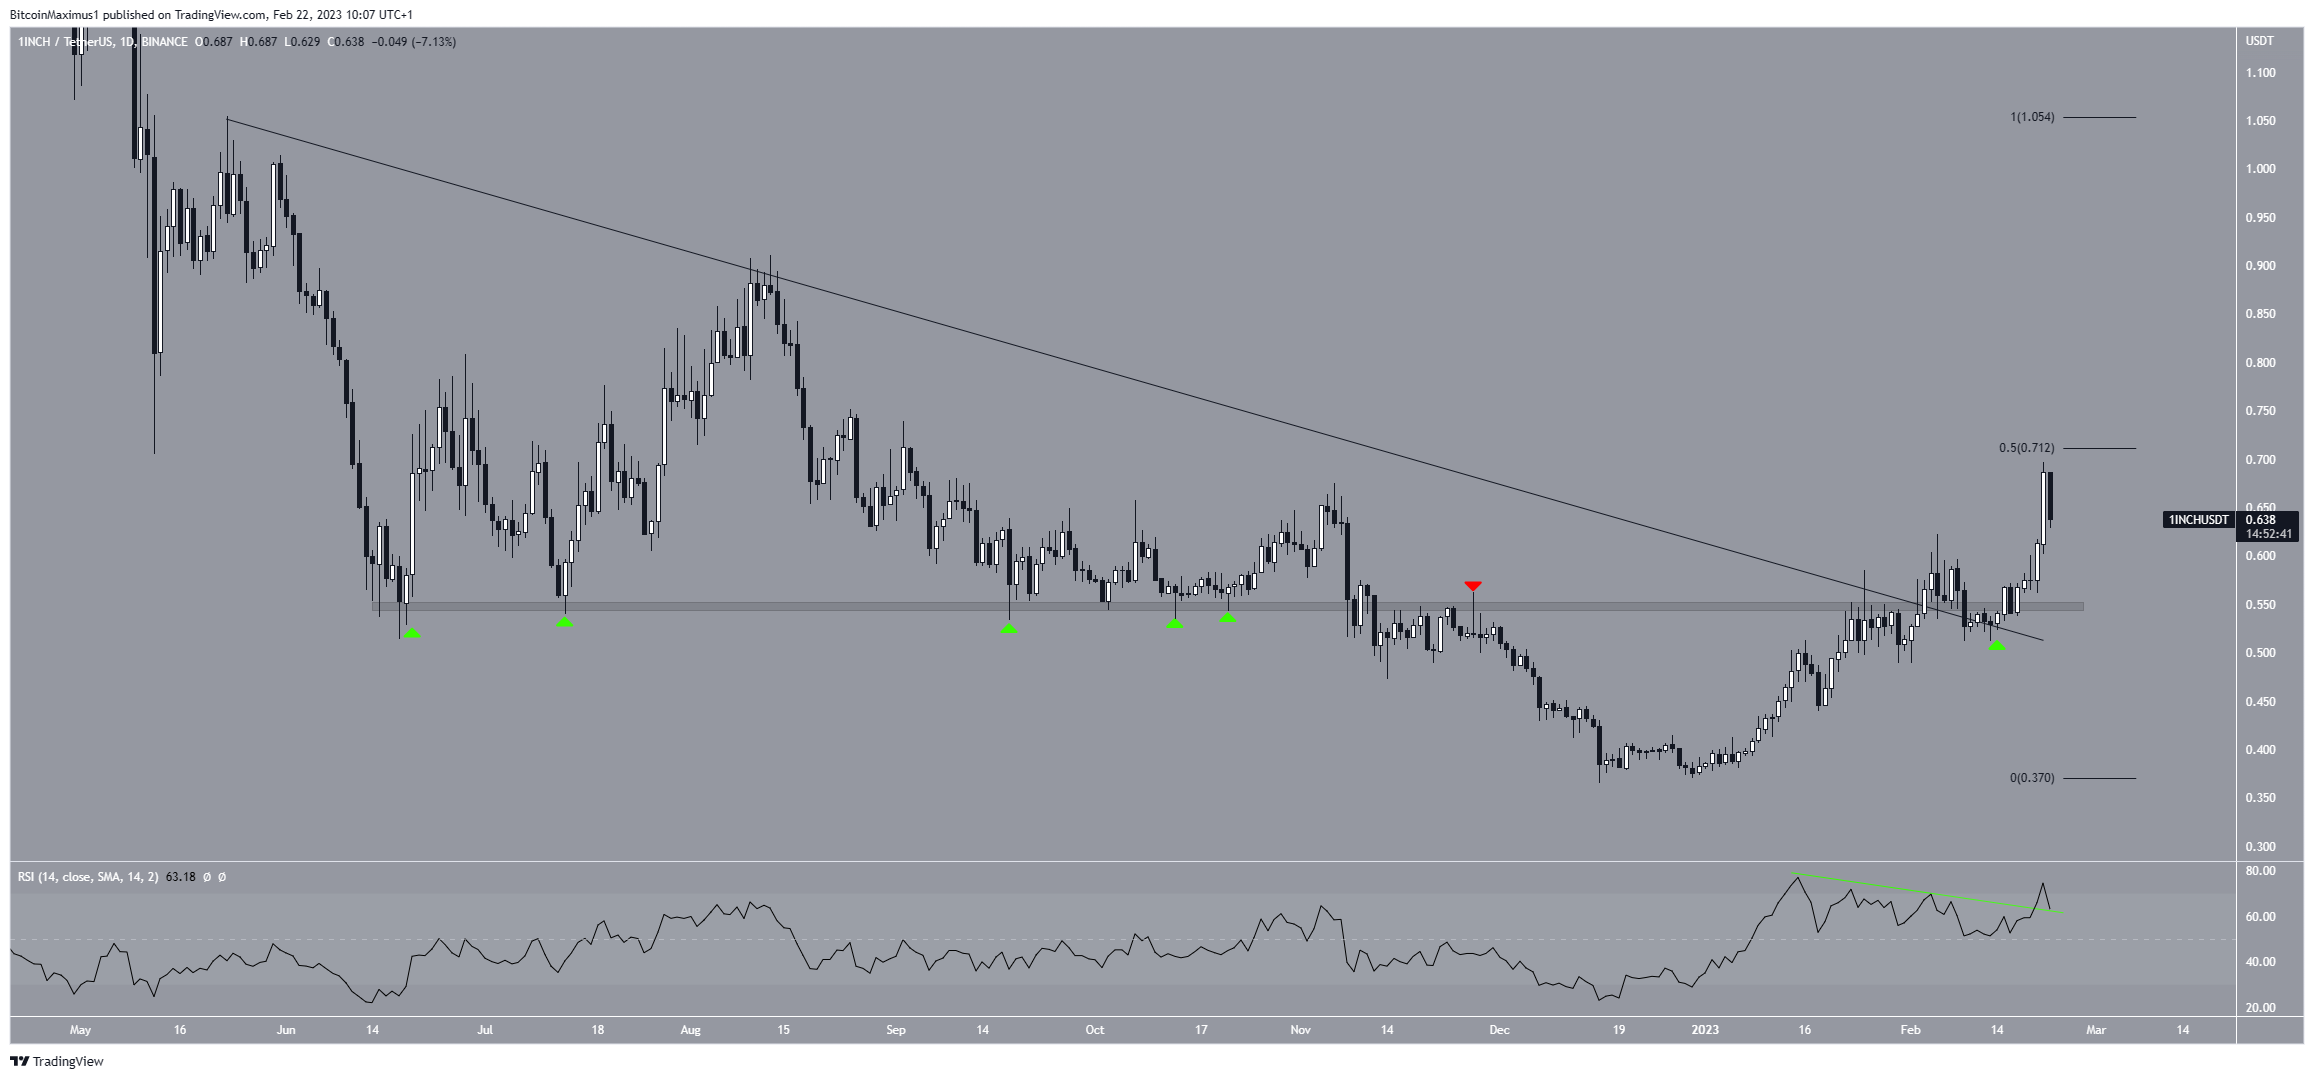
The 1INCH price had fallen below a descending resistance line since May 2022. The decrease led to a low of $0.36 on Dec. 16. The price reversed trend afterward and has increased since then. The upward movement caused a breakout from the resistance line and the $0.55 resistance area on Feb. 3. Afterward, it reached a high of $0.70 on Feb. 21. The high was made very close to the 0.5 Fib retracement resistance level at $0.71.
While the daily RSI generated a bearish divergence (green line), it broke out from its trend line and could validate it as support now.
If the 1INCH price breaks out above $0.71, it could increase to the next resistance at $0.85. On the other hand, if it gets rejected, a fall to the $0.54 area could follow.

Upward Movement Could Continue Despite Token Unlock
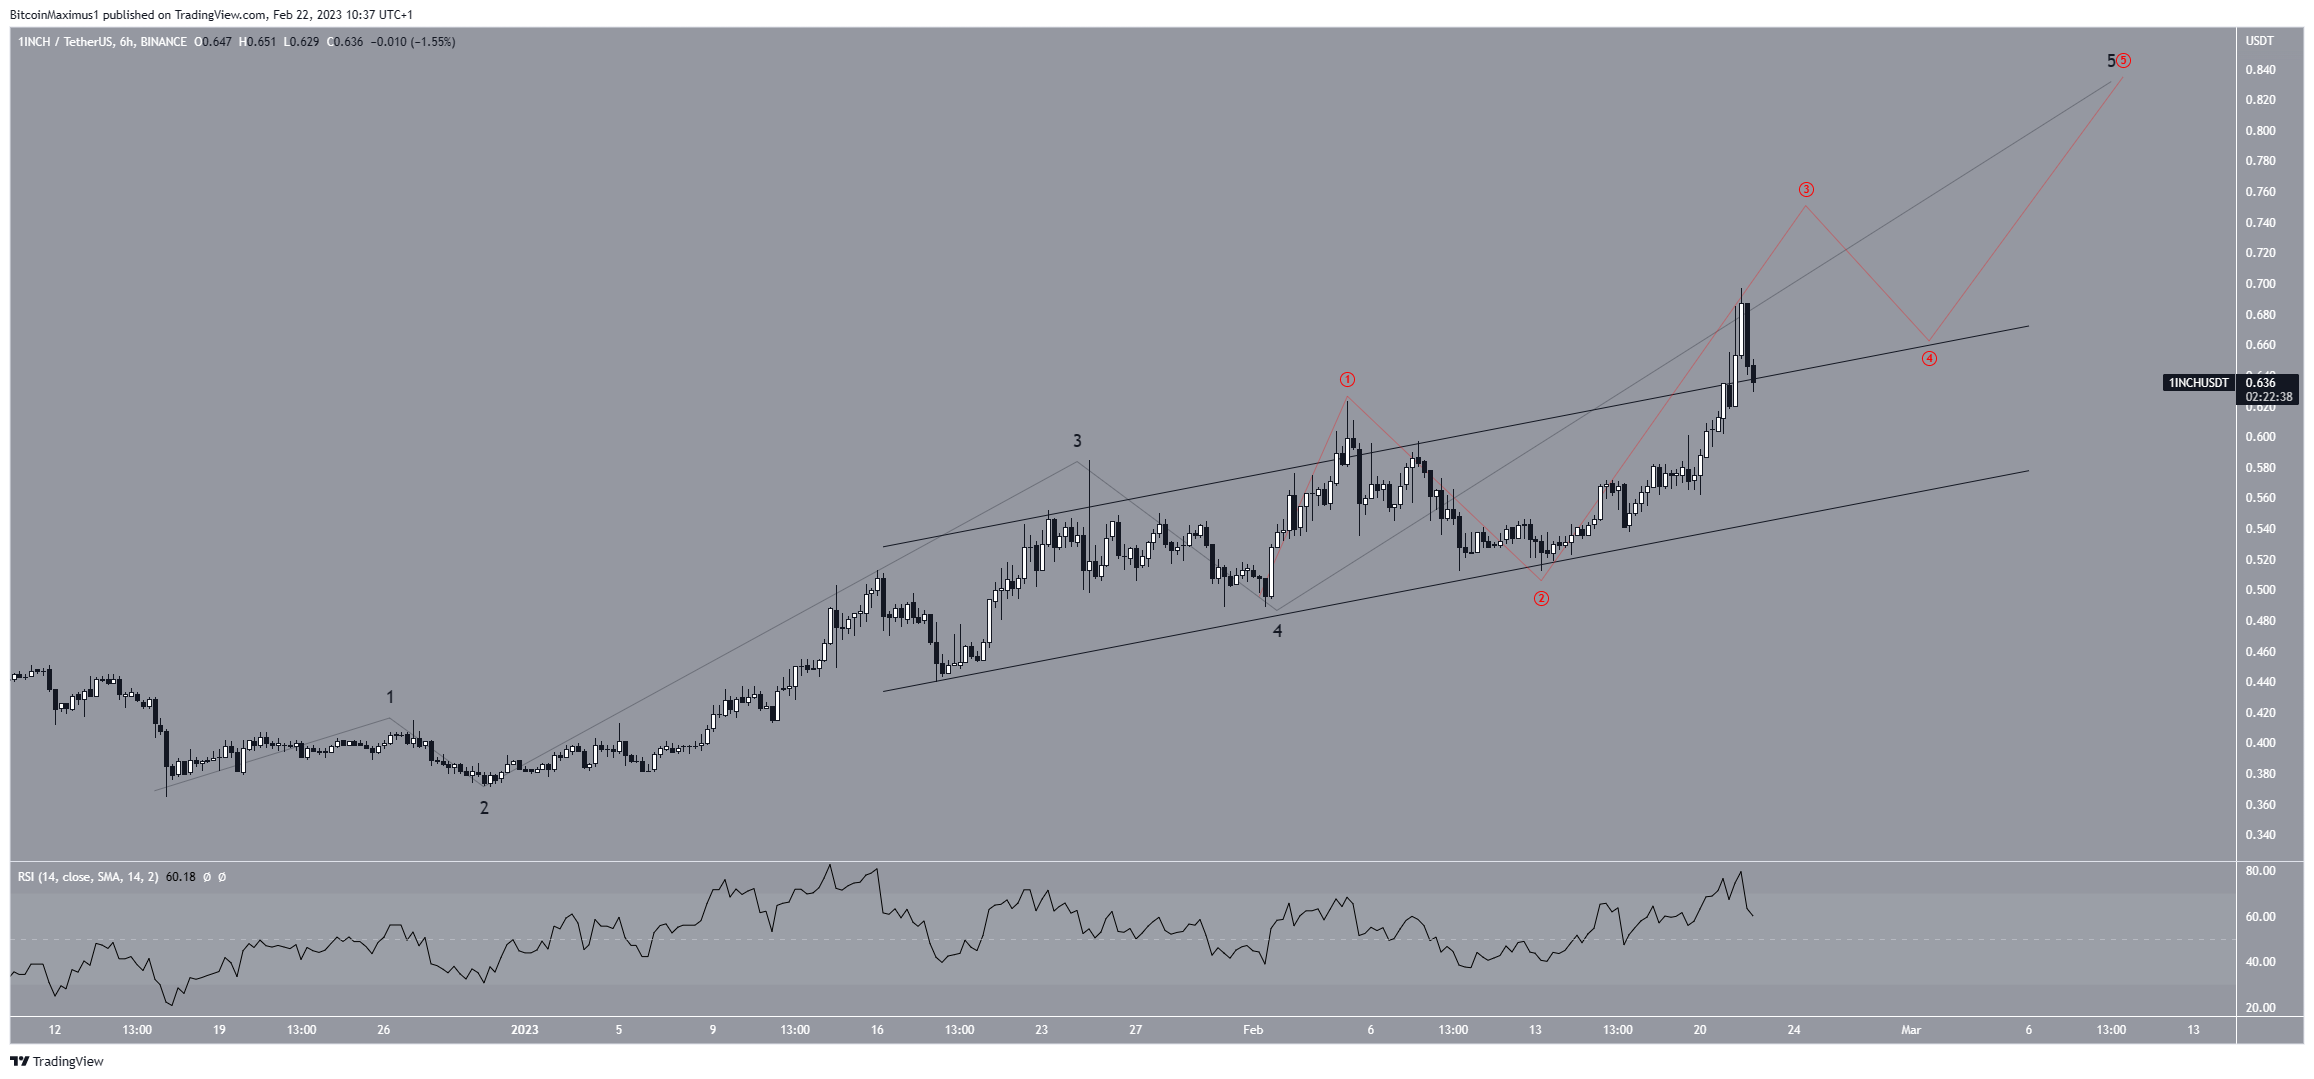
The technical analysis from the short-term six-hour chart supports the continuation of the increase. There are three main reasons for this.
First, the wave count suggests that the price is in the fifth and final wave of an increase (black). The wave has extended, as evidenced by the sub-wave count (red).
Second, the price has broken out from an ascending parallel channel. It is currently validating its resistance line as support (green icon).
Finally, the RSI has not generated any bearish divergence.
Therefore, the most likely outlook is the continuation of the increase toward the previously outlined resistance area at $0.85.
On the other hand, a decisive close below the channel’s resistance line would invalidate this bullish price forecast. In that case, the 1INCH price could fall to $0.54.

To conclude, the most likely 1INCH price forecast is the increase toward $0.85. However, if the price closes below the channel’s resistance line, it could catalyze a fall toward $0.54.
 beincrypto.com
