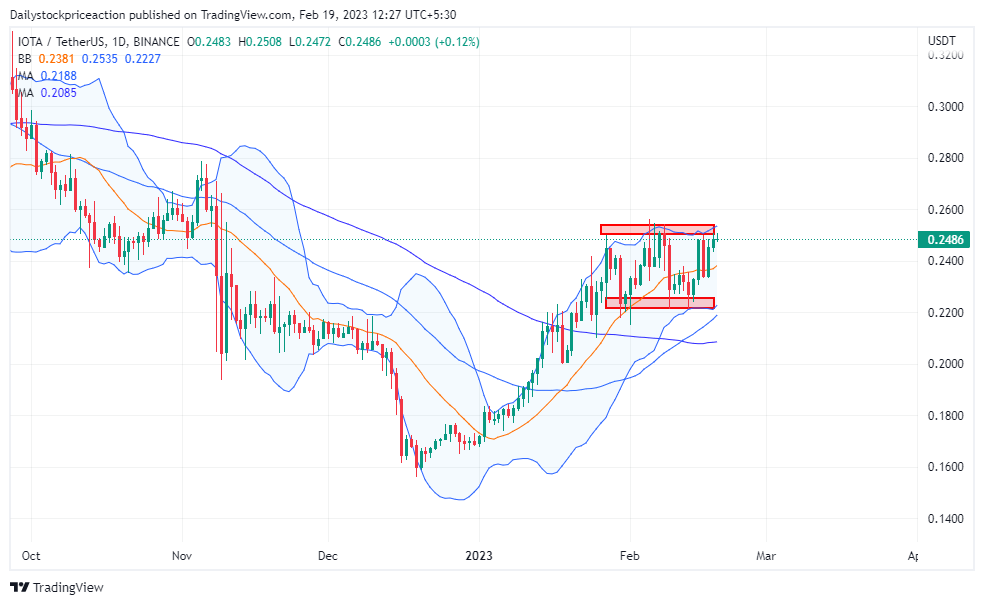
- IOTA token price has managed to sustain at the supply zone after rising to it with a steep move on a daily time scale.
- IOTA token price is forming a rounding bottom pattern on a daily time frame.
- The pair of IOTA/BTC is trading at the price level of 0.00001010 with an increase of 1.28% in the past 24 hours.
IOTA token price as per the price action is in a strong bullish mode. It has changed the price structure from bearish to bullish. It has started forming higher high and higher low formations on a daily time frame. At present, it transacting at the price level of $0.2487.
IOTA token price rushes to the resistance

According to the price action, the IOTA token price is forming higher high and lower low patterns on an hourly time frame from the demand and supply zones, respectively. On a broader time scale, the IOTA token price is now consolidating around a major supply. For a long time, the IOTA token price has been trading below the supply zone after breaking through the important demand zone.
The sideways parallel channel pattern has formed as a result of the uncertain pricing structure. The IOTA token price is now producing Doji candles, which are uncertain, and so the IOTA token price can break out on any side. The price of the IOTA token is currently trading below the 100 and 50 MA. As the token price rises, it is likely to be rejected by these MAs. If the token price successfully breaks the supply zone, it may result in the breakout of the 50 and 100 MA, which will then act as a support zone.
The IOTA token price has passed the 14 SMA, and signalling a bullish trend is about to begin. The IOTA token price is now trading at the upper band of the Bollinger band indicator. The Bollinger band’s range has expanded, indicating a massive consolidation and then a breakout on either side. Volumes have been consistent as the token price prepares for a breakout.
IOTA token price forms a flag and pole pattern on a daily time scale

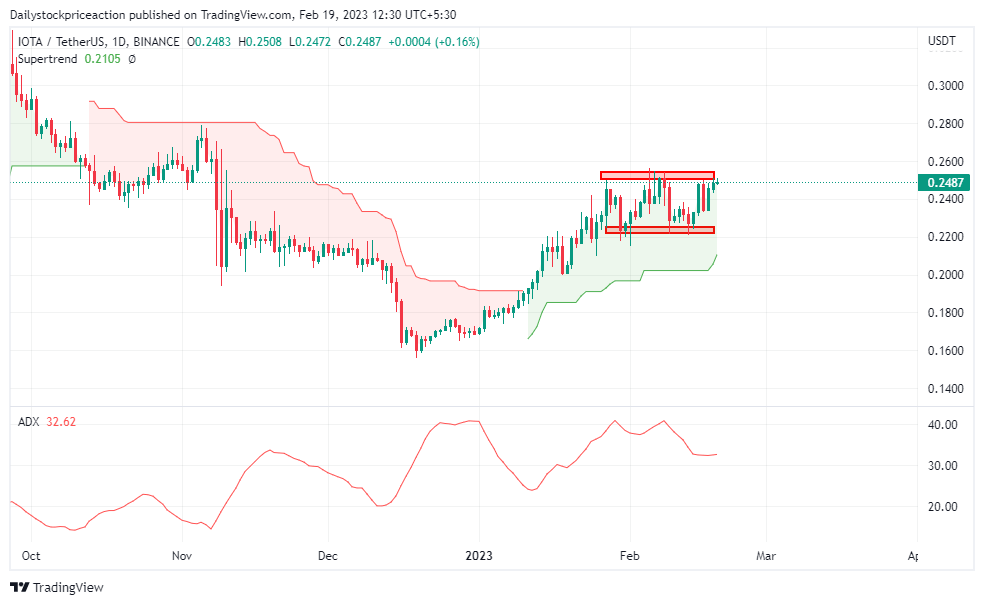
ADX curve has been dipping on a higher time frame as the coin continues to fall. In a daily time frame, the ADX curve has dipped out of the 20 mark and has turned upwards. As the club price rests at the short-term demand zone on a 4-hour time frame. It is a positive sign for the token price. Investors should wait for a positive candle formation at the demand zone.
Supertrend indicator is positive as the token price broke the important small-term supply zone on the daily timeframe. Since then the coin price has failed to give a breakout of the supply zone in a larger time frame. As of now, the token price has broken the super trend sell line which has triggered a buy line.
Conclusion: IOTA token price as per the price action is super bullish and the same is depicted by the technical parameters. Despite a strong consolidation the technical parameters are not losing strength indicating a bullish trend to prevail in the upcoming trading months. It remains to see if the token price will break the long-term resistance or will fail to do so and fall.
Support: $0.22 and $0.19
Resistance: $0.25 and $0.27
Disclaimer
The views and opinions stated by the author, or any people named in this article, are for informational purposes only, and they do not establish financial, investment, or other advice. Investing in or trading crypto assets comes with a risk of financial loss
 thecoinrepublic.com