- RUNE token price has been in a downtrend for the past weeks and recently it started consolidating resulting in range formation.
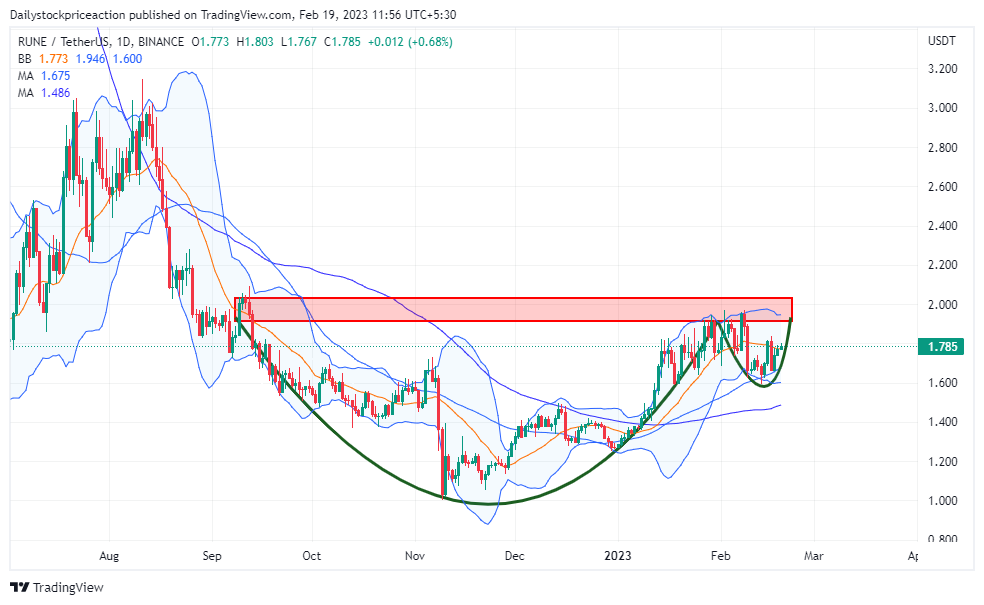
- The token price is trading in a small range while forming a cup and handle pattern on a daily time frame.
- The pair of RUNE/BTC is trading at the price of 0.0000722 with an increase of 2.49% in the past 24 trading hours.
According to price activity, the RUNE token price is circling the supply area. Despite recent bearishness across the board in the cryptocurrency market, the price of the token has managed to bounce off the demand zone. The token price is currently experiencing rejection of the supply zone despite showing significant bullish pressure from the demand zone.
RUNE token price manages to tackle bearish pressure

After bouncing off the demand zone, the token price is currently trading at the upper band of the Bollinger band indicator. On a weekly time scale, the token price is steadily rising after seeing bearish pressure over the long-term time frame. The price of the token has broken through the 14 SMA. It is now at rest at the 14 SMA. The token price is now trading above 50 and 100 MA.
Rune token price, as the price action suggested, has formed a reversal chart pattern after showing great strength despite pressure from the bears. The token price may be seen taking support of the moving averages as it moves upward. Volatility has risen as a result of rising volumes. Investors should thus exercise caution and wait for a significant breakthrough.
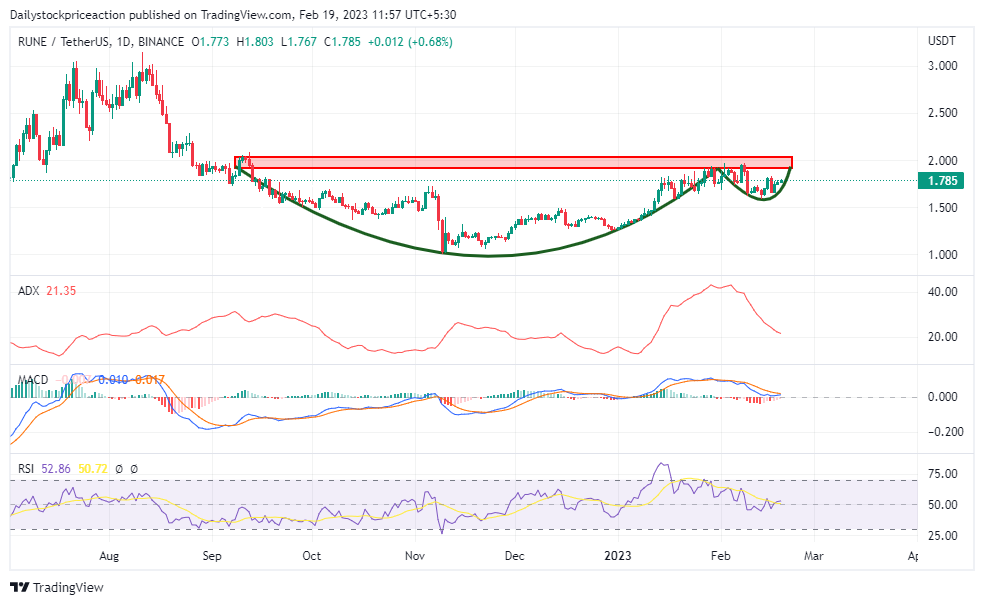
The RUNE token price is forming a cup and handle pattern on the daily time frame

The RSI curve is trading at the price of 53.40 as the token nears the supply area. At present, the RSI curve has crossed the 20 SMA. The token is forming higher low and higher high formations on a 4-hour time frame as the token shows bullishness in the higher time frame. The RUNE token price can be seen moving when it breaks out of the cup and handle pattern and the RSI curve moves higher.
MACD indicator has given a positive crossover as the token gave a breakout of the supply zone. The blue line crossed the orange line on the upside. This has resulted in the token price moving up strongly in a 4-hour time frame. Recently the RUNE token price fell after the breakout of small resistance. Once the token price starts moving up again after breaking the supply zone, the gap between the blue and orange lines can be seen widening supporting the trend.
ADX has been continuously rising as the token price broke an important supply zone of $1.63. As of now, the token price is trading above this important demand zone. The breakout zone is now acting as a strong demand zone. At present, the token price is trading at $0.08707. The ADX curve has dipped out of the 20 mark.
Conclusion: RUNE token price is in an uptrend on a smaller time frame. While on a larger time frame, the token is conRUNEidating in a small range. The technical parameters are bullish. It remains to see if the token price will break out of the range on the upside or downside.
Support: $1.6 and $1.4
Resistance: $1.9 and $2.1
Disclaimer
The views and opinions stated by the author, or any people named in this article, are for informational ideas only, and they do not establish financial, investment, or other advice. Investing in or trading crypto assets comes with a risk of financial loss.
 thecoinrepublic.com
