- Filecoin has entered an uptrend by constantly forming higher highs and higher lows.
- Indicators show a buy signal for the coin.
- An Ascending triangle pattern breakout has occurred on the daily chart which may now lead to a bull run.
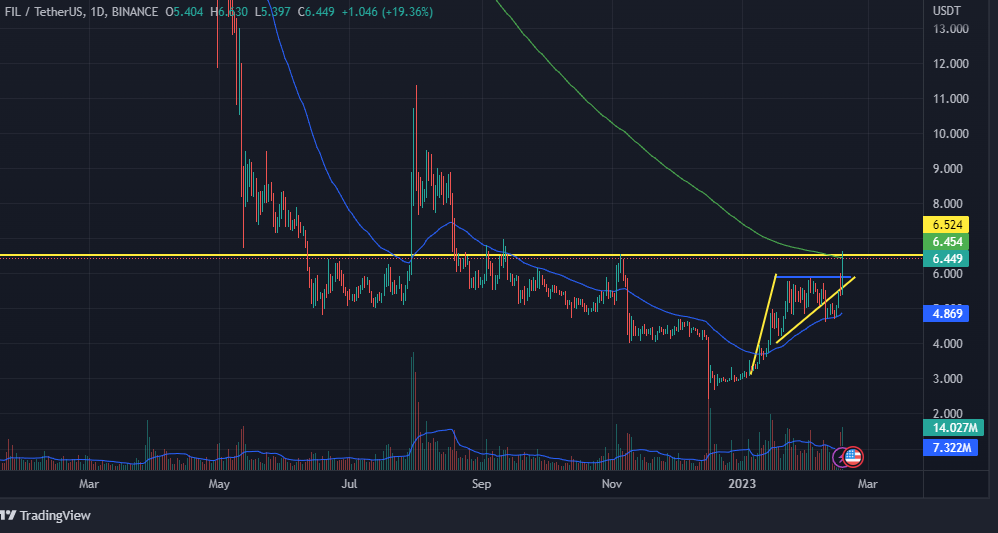
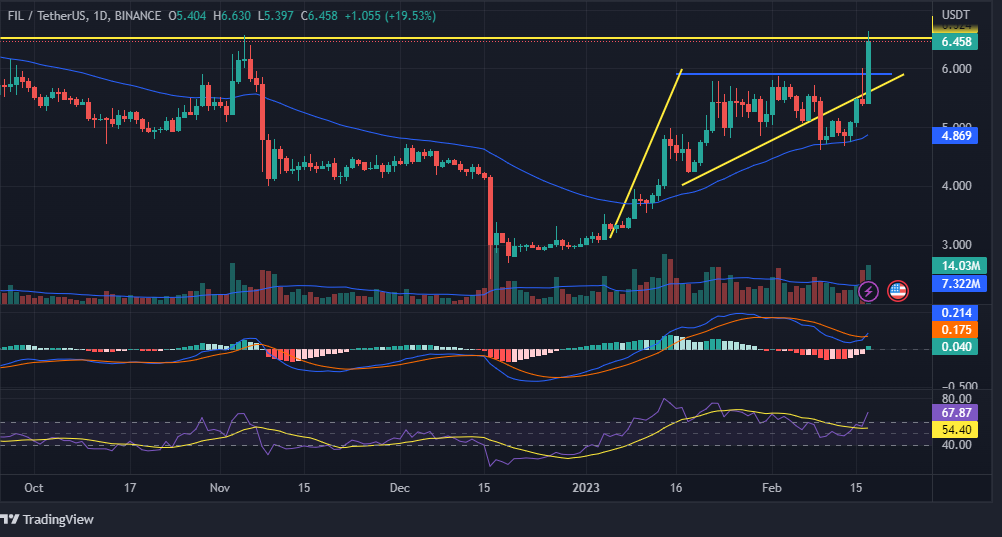
Technical analysts may have observed the breakout of an ascending triangle pattern formed on the daily chart. After the breakout, coin has formed a strong green candle. It is anticipated that the coin from hereon may show a strong bull move. Moreover, the price at which coin is currently trading at the time of writing is one of its resistance levels.
An Ascending triangle breakout is visible on daily chart

On the daily chart, investors may have noticed that the coin after breakout of the pattern has reached one of its resistance. Previously, coin has displayed a sharp increase in prices after crossing this resistance, so a similar move can be expected once again Although it is expected that coin may continue the bull rally, but there are other possibilities too that coin may consolidate for a little while before continuing its bull rally. A Golden Crossover may also occur as soon as the price of coin increases more.

The MACD indicator has shown a bullish crossover, signaling that bulls have taken command over bears and the investors may now see an increase in the prices of Filecoin. On other hand, RSI curve is above its 50-point threshold at 67.87. The RSI curve’s value may increase with the increase in prices of the coin.
Overall, both the indicators, that is, MACD and RSI are presently providing a buy signal.
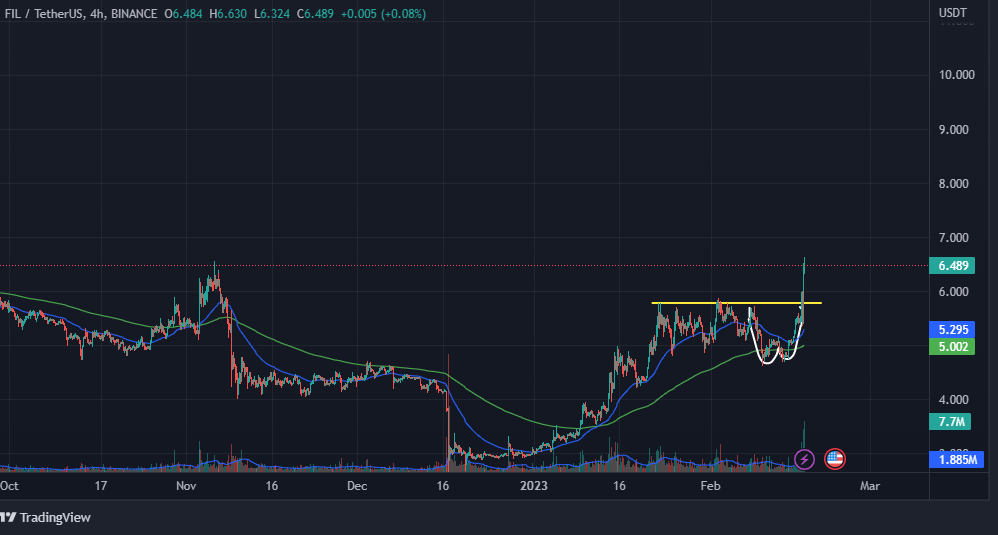
Double Bottom pattern breakout visible on short-term chart?

The short-term chart has a similar price movement to that of daily chart. It is clearly visible that coin from its major support level, that is, from around $2.923, displayed a strong bull rally. A Golden Crossover also occurred during that time which may also be the one of the reasons for the increase in price of the coin. Apart from this, a double bottom pattern breakout is also visible on the short-term chart.
Conclusion
Investors may have concluded by looking at both the short-term and daily charts that either coin may continue its bull rally or it may look to consolidate for some time at current price levels before resuming its bull run. Moreover, investors anticipate that a Golden Crossover may also occur on the daily chart soon.
Technical Levels
Resistance levels – $6.744 and $8.892
Support levels – $4.166 and $2.293
Disclaimer: The views and opinions stated by an author, or any people named in this article, are for informational purposes only, and may not establish financial, investment, or any other financial advice. Investing in or trading crypto assets comes with a risk of financial loss.
 thecoinrepublic.com