
$QNT token on the charts willing to reverse the trend direction, as confronted with the hope of Pole & Flag pattern. If the token breaks the upper trendline, then bulls aggressively bounce back. Moreover, $QNT token builds its strong base at $100.
From the start of 2023, the token traded inside the rising parallel channel and made highs of $165. Afterward, the token was retraced back and formed a pole & flag pattern.
At the time of writing, $QNT is trading at $138.80, with a dip of 3%. Moreover, the trading volume also slips by 5%.
Daily chart shows Pole & Flag Pattern
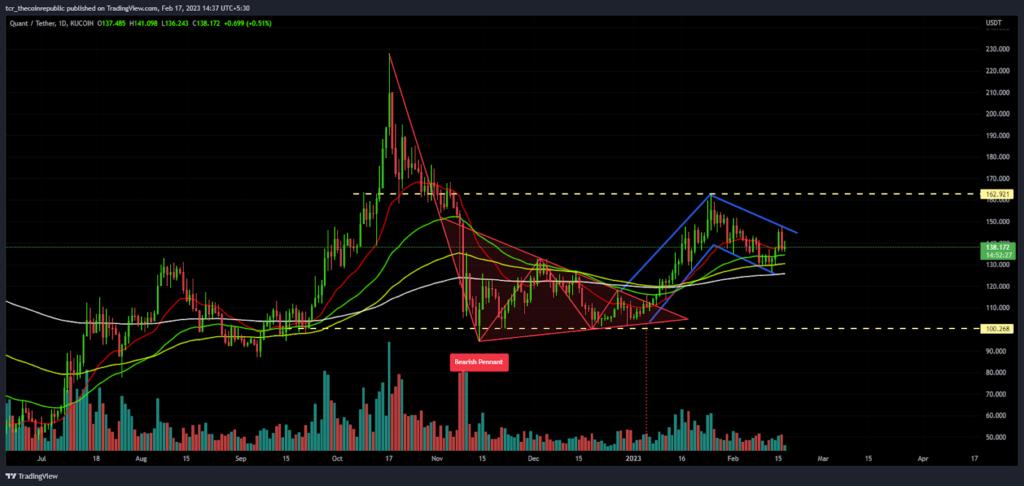
On the daily chart, $QNT shows some reversal indications now, charts reflecting that price trades above the significant moving averages. The immediate support is at multiple EMA’s placed near the $130 range signalling the lower trajectory is not far from the current levels. On the other side, the upside trajectory is the previous swing of $160.
Quant token corrected by 18% in this month and made a base around $125, and now it will crack the resistance of $150 in the near sessions.
The bears attempted to push the price to the support range in the last sessions, but the bulls held the grips flawlessly. This indicated that the buyers were keen to pull the token price again. The token is awaiting strong addition of volumes to break the hurdle of $150.
Short Term Chart Forms Falling Wedge Pattern

On the 4 -hours chart, $QNT forms a falling wedge pattern displaying clear signs of a trend reversal. In the upcoming sessions, the token will retest the highs further. $QNT tests the lower range and jumps from the Bollinger band’s lower end to the middle zone.
$QNT token this week violated the trendline and leaped toward $145. Afterward, it retraced back and took support at its 20- days EMA. Currently, the token is prepared to pass with flying colours. The token trades in the bullish territory till it holds above $130 and falls were swamped with the buyer’s entry.
What Traditional Indicator say ?

RSI( Neutral): The RSI curve is positioned at 50, whereas it slips from the overbought zone and takes halt near the neutral zone. The curve intersects the signal line and looks to bounce again.
MACD: The MACD indicator is signalling that the red bars are coming to an end and bullish crossover is awaiting in upcoming hours.Moreover, it also reflects neutral sentiments.
Technical Levels
Support levels:$125
Resistance Levels:$160