The market is mainly trading sideways after a recent correction.
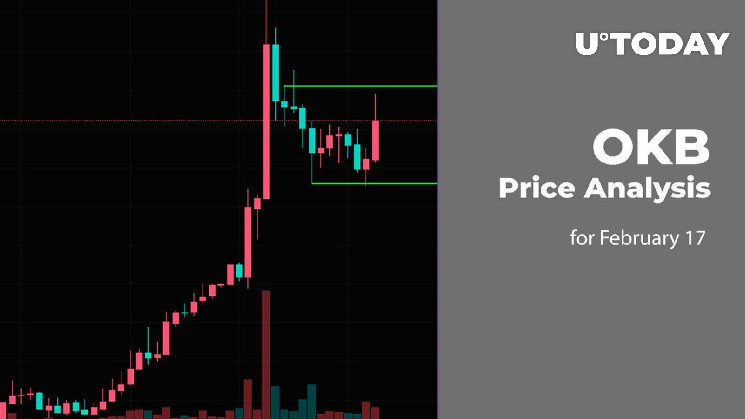
$OKB/USD
The rate of $OKB keeps rising by around 5% over the last 24 hours.
$OKB/USD chart by TradingView" src="https://cnews24.ru/uploads/2a1/2a1fac3b000ca70dd3d8d66c1e4dede00d1afb7e.png" size="1828x874">
On the hourly chart, the price of $OKB has broken the local resistance at $49.80, which means that bulls remain more powerful than bears. From another point of view, the altcoin has passed most of its daily ATR, and sideways trading in the area of $51-$51.50 is the more likely scenario.
$OKB/USD chart by TradingView" src="https://cnews24.ru/uploads/c05/c0560fa941129b3f965f2426e800500cd168785e.png" size="1816x864">
On the daily time frame, traders should pay attention to the mark of $52.80. If the bar closes near it, there are chances to see a breakout, followed by a blast to the $55 zone. Thus, the volume is growing, which means that bulls are ready to keep the midterm bull run going.
$OKB/USD chart by TradingView" src="https://cnews24.ru/uploads/35b/35b07c8f8a8b97d60b6ec03a98e72a1c88efe826.png" size="1816x864">
A similar situation can be seen on the weekly time frame, as the price has broken all possible levels and is setting new peaks now. Currently, the zone of $50 plays an important role for bulls in terms of further growth.
If buyers can hold the rate above that mark, the upward move may continue to $60.
$OKB is trading at $51.479 at press time.