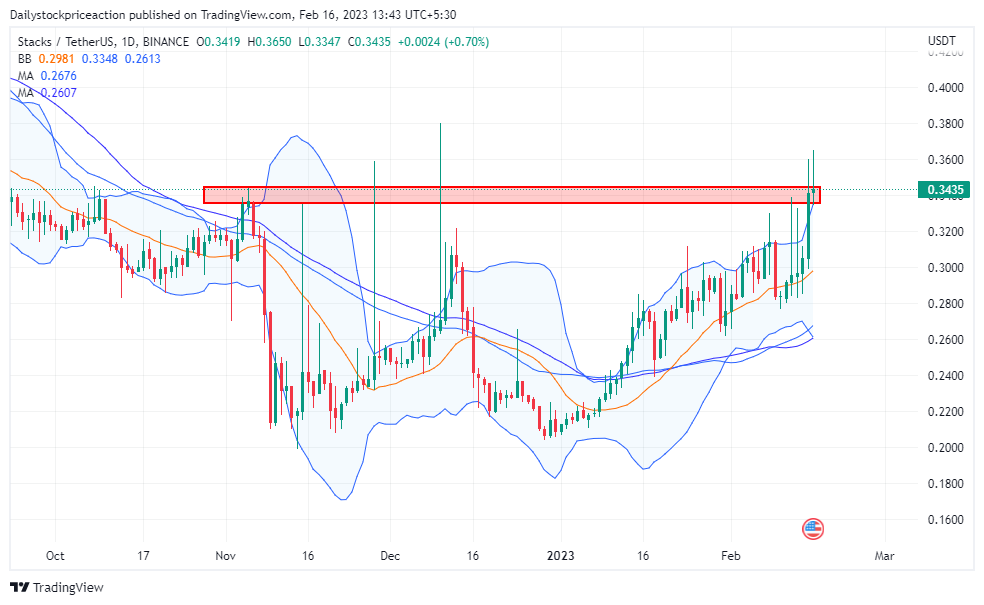
- STX coin price is trading at the supply zone following the strong bullish pressure from the demand zone.
- The STX coin price has formed a rousing bottom pattern on a daily time frame.
- The pair of STX/BTC is trading at the price level of 0.0000138 with a decrease of 1.29% in the past 24 hours.
Before the current bullish movement, the STX coin price traded in the demand zone with little volume. As of now, the STX coin price has reversed from the demand zone showing a U-shaped recovery. Currently, the coin price is transacting at the price level of $0.3430.
STX coin price has shown a strong reversal

The STX coin price is currently trading above the 50 and 100 Moving Averages after a strong bullish Pattern in the last couple of days. Recently the coin price formed a strong bullish candlestick pattern at the supply zone indicating a strong bullish pressure. The recent movement has resulted in the coin price surpassing the important MAs. Moving towards the coin price can be seen taking support at these MAs.
At present, the coin price is resisting at the upper band of the bollinger band indicator after a pullback from lower band. If the coin price manages to hold the current level and surpass the long-term supply zone then it can be seen surpassing the upper band of the Bollinger band indicator. Volumes have increased as the coin price showed an erratic movement.
STX coin price is forming a rounding bottom pattern on a daily time frame

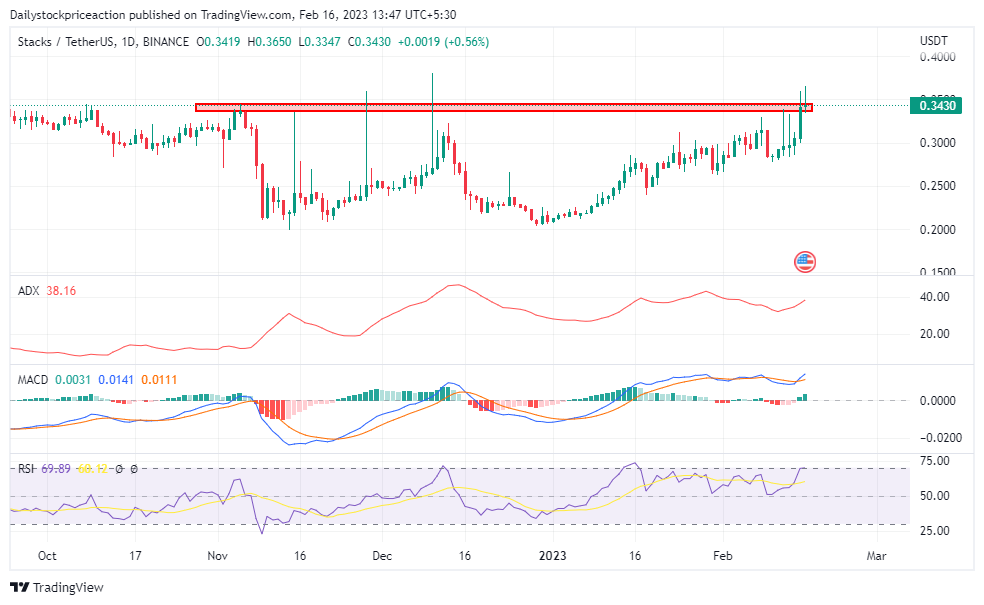
The average directional movement index has been on a rise following the bullish momentum in the coin price on a daily time frame. The STX coin price was floatingtransacting below the level of 30 but recent movement led to the ADX curve turning upwards indicating a possible change in the price structure. As of now, the ADX curve has dipped out of the 30 levels.
Moving Average Convergence Divergence has given a positive crossover as soon as the coin price managed to bounce off the demand zone. If it manages to surpass the supply zone on a daily time frame then MACD lines can be seen widening supporting the price movement.
At present, the Relative Strength Index is trading above the halfway mark of 50 indicating bullishness. Previously the RSI curve was trading below the halfway mark as the coin price was stuck at the demand zone. With recent bullishness, the RSI curve has reached highs nearing the overbought zone therefore investors should remain cautious and not get caught in a trap.
Conclusion: The STX coin price is forming a higher high and higher low price structure on a daily time frame. The technical parameters are also bullish as the coin price rose to the supply zone. It remains to see if the coin price will break through the supply zone or fall below it facing strong pressure front bears.
Support: $0.30 and $0.27
Resistance: $0.35 and $0.38
Disclaimer
The views and opinions stated by the author, or any people named in this article, are for informational ideas only, and they do not establish financial, investment, or other advice. Investing in or trading crypto assets comes with a risk of financial loss.
 thecoinrepublic.com