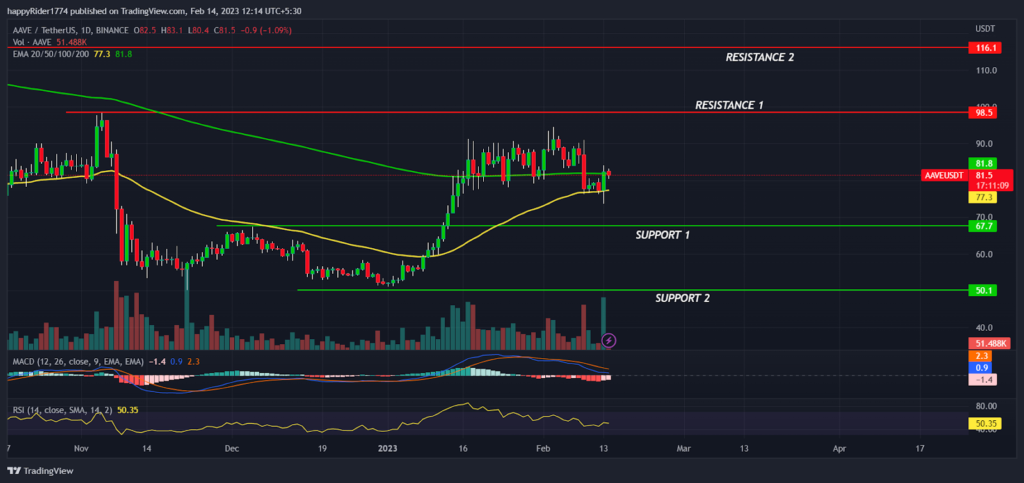
- AAVE coin price struggling to defend the 50 and 200 day EMA
- AAVE/USDT price bounce back after testing the previous week low at $76.2
- The volume of AAVE coin is surged 323% in the last 24 hours
AAVE coin prices are trading with mild bearish cues and bear’s are trying to drag the prices below the 50 and 200 day EMA to disturb the sentiment of the investors but the prices are near to the important support zone and bulls are likely to bounce back from the lower levels. Currently, The pair of AAVE/USDT is trading at $81.7 with an intraday loss of 0.85% and the 24-hour volume to market cap ratio at 0.2272
AAVE price bottomed out, downside seems limited?

AAVE crypto price had shown a decent recovery of 80% approx from its yearly lows and formed a double bottom bullish reversal pattern but unfortunately price lacked the follow up movement and got stuck into the narrow range consolidation. Meanwhile, the AAVE bulls have tried multiple times to break out of the $90.00 hurdle levels but bear’s seem to be very active on the higher level and not willing to give up their dominance on the supply zone.
AAVE coin prices have managed to sustain above the 50 and 200 day EMA which shows that the bulls are still alive and the short term trend remains in the direction of bulls. However, if the prices slips below the EMA’s then $67.00 will be acting as the savior for bulls and prices are expected to bounce back for the support levels. On the higher side, If bulls succeed to breakout of the $90.00 hurdle level then may see a rally toward $100.00 which will probably the beginning the upside range expansion.
The technical indicators of AAVE coin are indicating mild bearishness but the price action seems to be supporting the direction of bulls.The MACD has generated a negative crossover but the curve is tilting sideways indicates range bound trading to continue for some more time and the RSI at 50 denotes the balance between bullish and bearish positions.
Summary
AAVE coin prices have lacked the follow up movement and got stuck in the narrow range which seems to be testing the patience of the long term investors. The technical analysis shows that the trend is working in the direction of bulls and prices are expected to see the upside expansion. However, If the price drops below $67.00 then it will create a matter of concern for the short term traders as well as for long term investors.
Technical levels
Resistance levels : $98.00 and $116.00
Support levels : $67.00 and $50.00
Disclaimer
The views and opinions stated by the author, or any people named in this article, are for informational purposes only, and they do not establish financial, investment, or other advice. Investing in or trading crypto assets comes with a risk of financial loss.
 thecoinrepublic.com