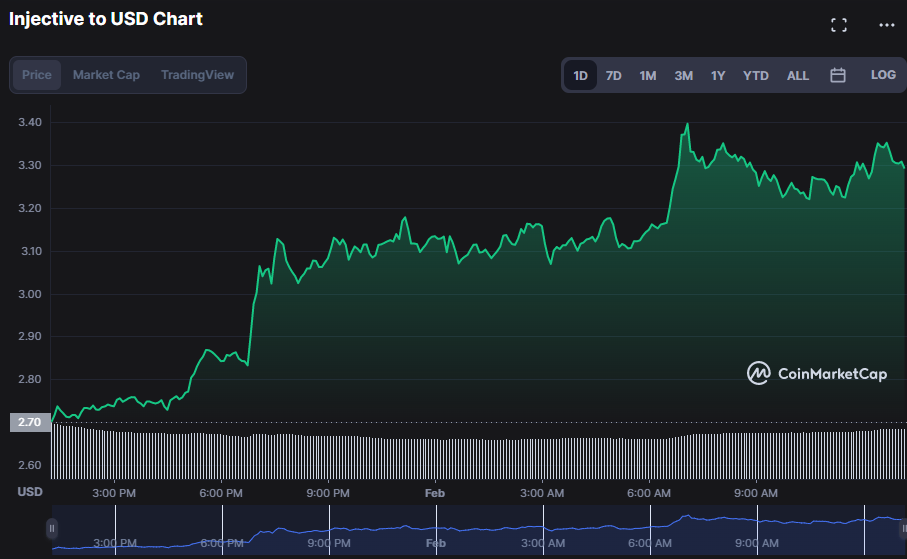
Throughout the day, cheerful optimism prevailed, with the Injective (INJ) market showing a firm hand. Due to the bulls’ dominance, the INJ price varied from $2.70 to $3.41 (support and resistance levels). As of this writing, the INJ price had risen to $3.30, reflecting a 21.64% boost.
Due to this positive trend, the market capitalization climbed by 21.56% to $241,106,391; nevertheless, the 24-hour trading volume decreased by 2.32% to $118,049,952.
This positive trend, along with a rise in market capitalization and a fall in 24-hour trading volume, implies that investors are purchasing Injective tokens to maintain value despite lower market liquidity.

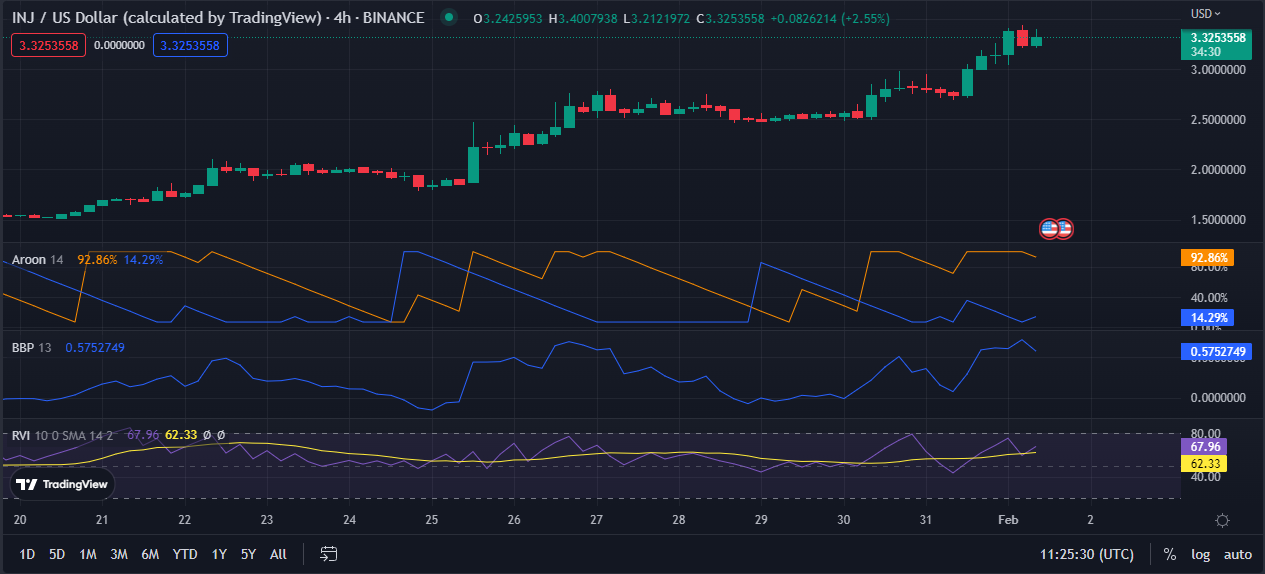
The Aroon up reads at 92.86, while the Aroon down reads at 14.29, indicating a bullish bias in the market since the strength of the ascending trend outnumbers the power of the downward trend. This move is notably suggestive of a robust bull market since the Aroon up reading of 92.86 shows that the uptrend has been there for almost the entire period, with the Aroon down reading of 14.29 being small in contrast. This motion means that the price will likely go up even more, and the positive trend might continue.
Adding to the concept of a “bull run,” the Relative Volatility Index (RVI) reads 68.02 and swings over its signal line, suggesting a considerable increase in market volatility as the price rises. This rise in volatility is a positive indicator since it typically signals that market players are growing more prepared to pay greater prices for the INJ. In addition, the movement of the RVI over the signal line indicates that traders are more active in their purchase orders, which raises the likelihood of additional price growth.
The Bull Bear Power (BBP) value of 0.5740586 reflects the market’s bullish mood by indicating that demand is expanding faster than supply. In addition, it shows that traders are more confident in purchasing the asset when volatility rises, implying that investors predict higher prices soon.

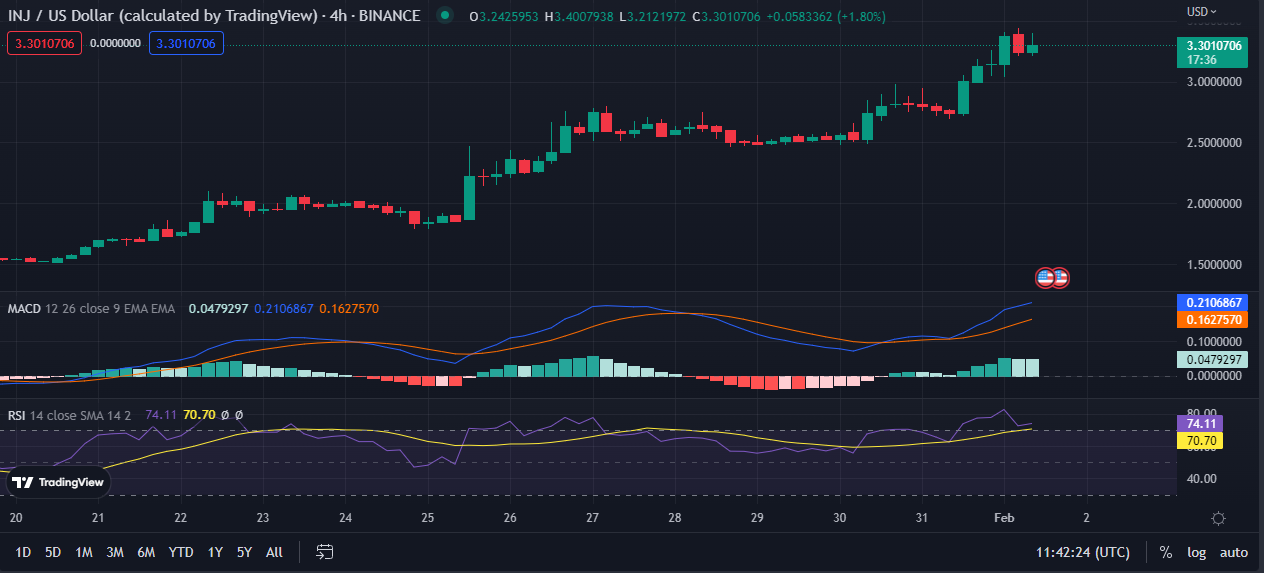
The blue MACD motion is above its signal line, with a value of 0.2140761, indicating rising positive momentum. This shift denotes that the INJ will likely continue its upward trajectory, meaning that now is a good time for investors to take advantage of the opportunity.
As seen by the RSI reading of 74.68 on the 4-hour chart, the market is now overbought, and the current price of INJ is above the anticipated price given the previous trend. This change is a warning indicator that the market may turn negative soon, and traders and investors should consider taking gains from INJ. In addition, the RSI reading is over 70 but below the 80 or 90 thresholds, which often precedes a significant sell signal. To mitigate this possible adverse risk, traders and investors should utilize stop-loss orders or reduce the size of their positions.

Bulls need to maintain pushing prices over the present resistance level if INJ is to continue its steady advance.
Disclaimer: The views and opinions, as well as all the information shared in this price analysis, are published in good faith. Readers must do their own research and due diligence. Any action taken by the reader is strictly at their own risk, Coin Edition and its affiliates will not be held liable for any direct or indirect damage or loss.
 coinedition.com