Kava
The cross-chain money market relies on KAVA as the base currency.
Past Performance of KAVA
The the price is relatively firm week-to-date, reading from the KAVA technical analysis of the daily chart.
Although bears might be in the driving seat, the rejection of lower prices may be the foundation of even better gains in the days to come.
Day-Ahead and What to Expect
Despite confidence among KAVA coin traders, sellers are in the driving seat.
When writing, the KAVA token is retesting the middle BB—a dynamic resistance line—previous support.
Even so, a high volume close above $6.5 and last week's high could draw demand, shifting the tables against sellers.
On the flip side, losses below $4.5 may signal more losses in the days ahead.
KAVA Technical Analysis
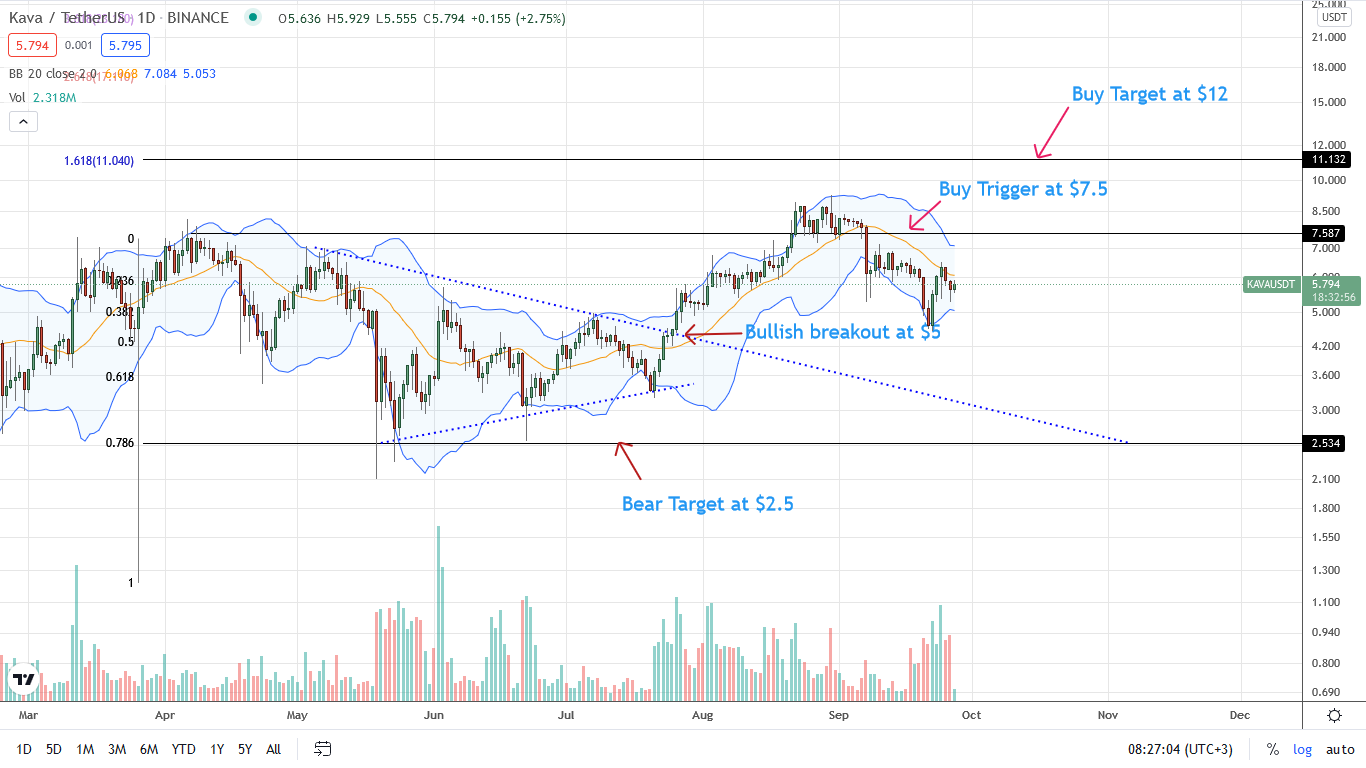
There has been a confirmation of the double-bar bullish reversal pattern of September 21 and 23, a refreshing development for buyers.
However, a close above $6.5 thrusts KAVA higher, placing it in a better position to retest $8.5 in a buy trend continuation pattern.
Conversely, losses below $4 would trigger a sell-off, leading to even deeper retracements.
Hard Protocol
The platform is the first cross-chain money market on the Kava protocol using HARD for governance.
Past Performance of HARD
The HARD crypto is bullish, printing higher highs versus the greenback. From the HARD technical analysis, buyers stand a chance, but there could be more if there are more gains above $1.4—June 10 bull bar.
Day-Ahead and What to Expect
Technically, the HARD token is bullish from an Effort-versus-Results perspective and as long as price action trends inside June 10 bull bar.
A close above $1.4 might see the HARD coin surge to $2.6 or better.
On the flip side, losses below $0.85—the 61.8 percent Fibonacci retracement level of the June 10 bull bar, may spark a sell-off towards $0.60—or lower.
HARD Technical Analysis
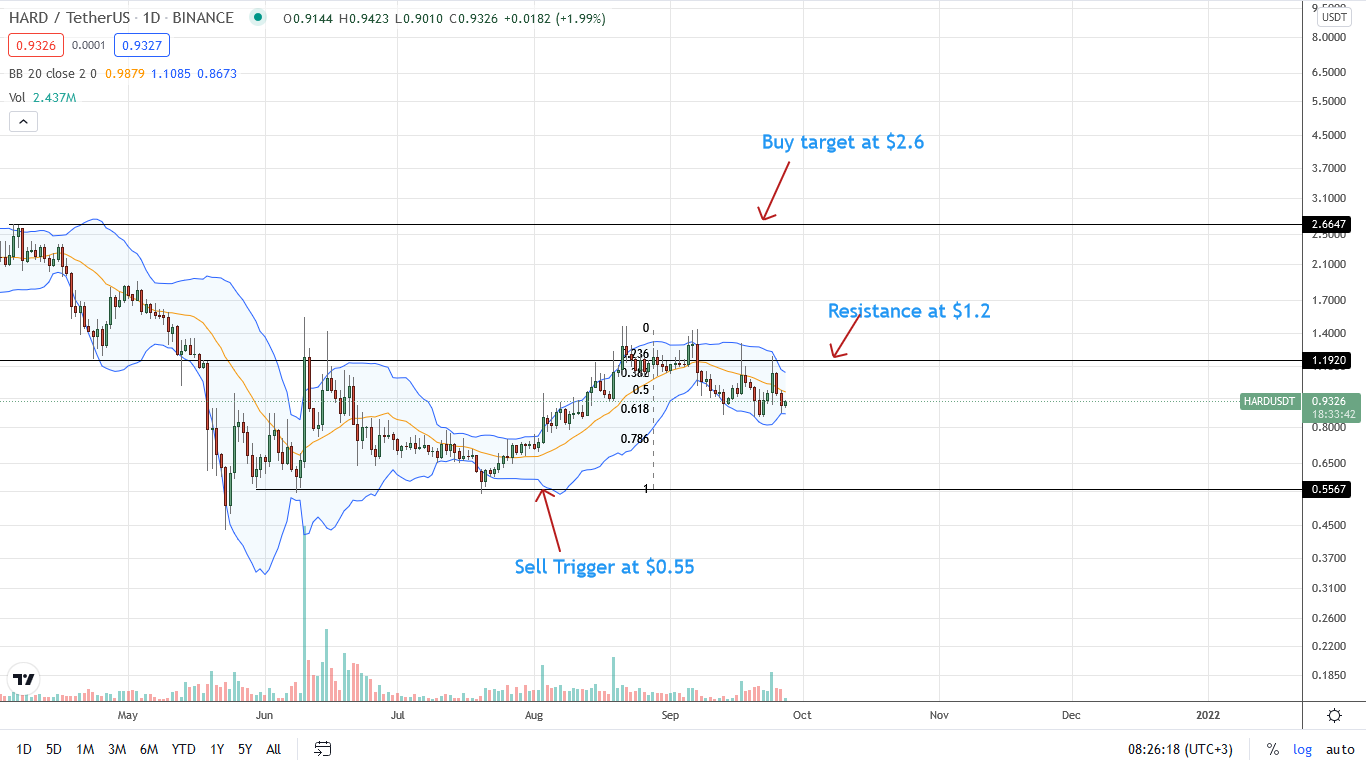
The HARD crypto is firm to the upside at the moment, but sellers are unyielding.
A breakout above June 10 highs and $1.4 might trigger demand, forcing a strong rally towards $1.6 in confirmation of the trend-shaping bar of June.
However, if there are losses below $0.85, bears of September 7 might flow back, forcing a dump to $0.70—the 78.6 percent Fibonacci retracement level of $0.60.