
- Token has shown bullish actions in previous sessions.
- The pair of $TRX/USDT is trading at the price level of $0.057 with a gain of 0.72% in the past 24 hours.
Tron Token was consolidating below the demand zone on a daily time frame and recently it gave a breakout and currently it is trading above the demand zone. Tron Token has entered a short-term bullish trend, and bulls are looking powerful, refusing to let bears force the token’s price down.
TRON ($TRX) on the daily chart
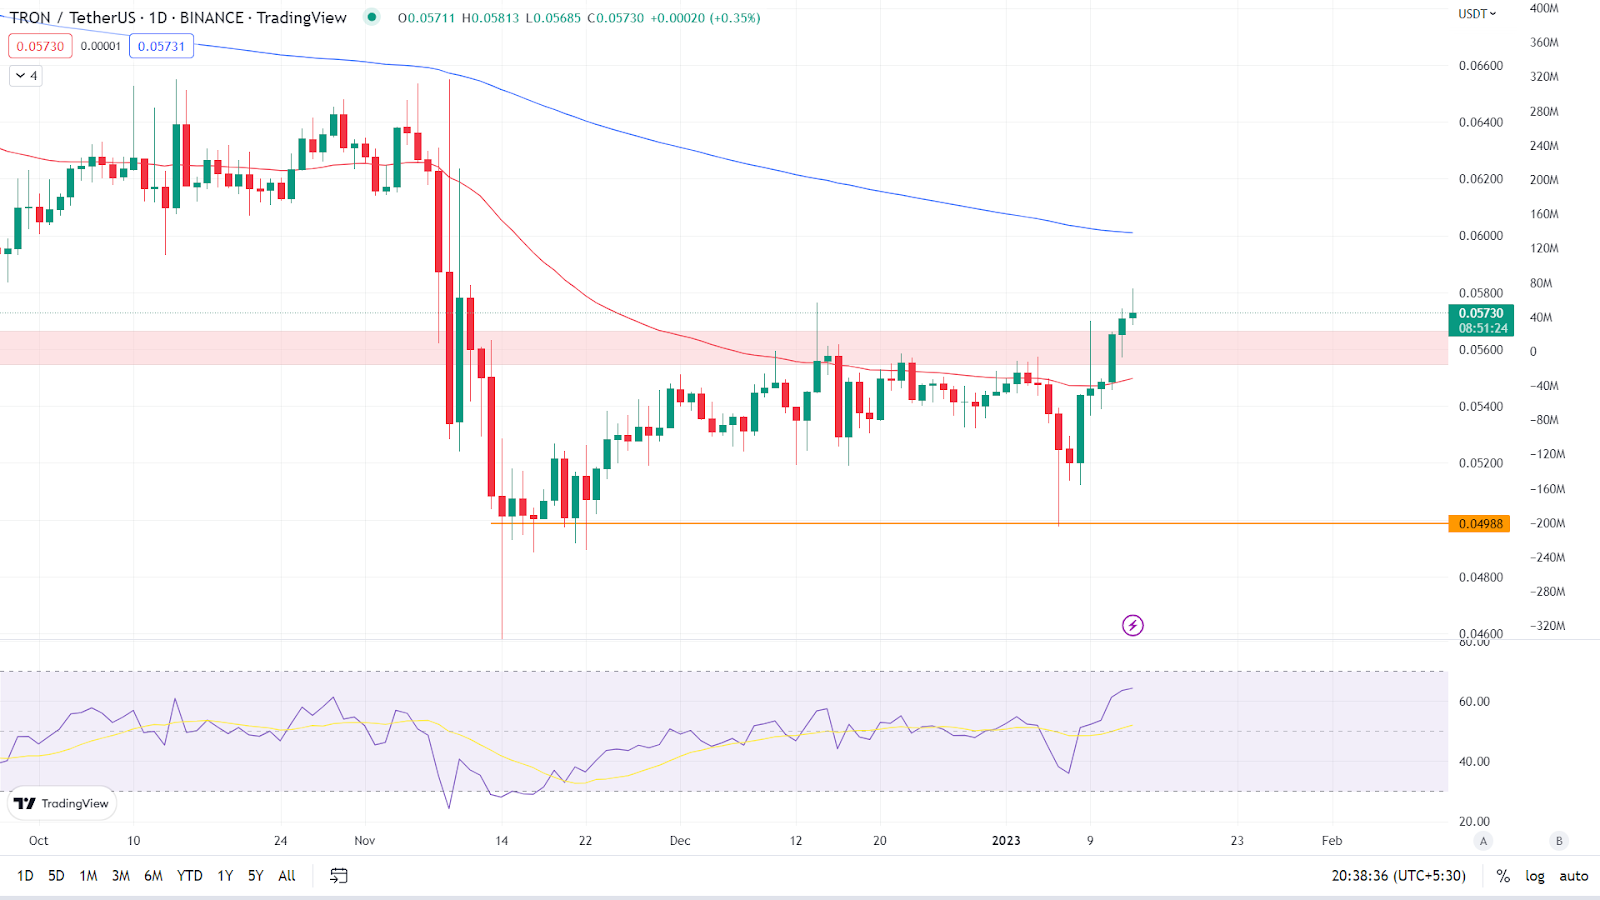
Over the last few days, the token has shown bullish momentum, generating strong bullish candles on the daily time frame. As we can see on the daily chart, $TRX token is trading at $0.057 with a gain of 0.72% in the past few days. It is trading between its two key Moving Averages, the 50 EMA and the 200 EMA. (Red line is 50 EMA and the blue line is 200 EMA). If the bullish momentum continues, the token may trade above the 200 EMA, indicating a strong uptrend.
Relative Strength Index: The asset’s RSI curve is currently trading at 65.75, indicating that it is in the overbought zone. As the token price is rising the value of RSI curve has also increased. The RSI curve has crossed over the 14 SMA, indicating that the market is bullish. If bulls continue to drive the token’s price higher, the value or RSI curve will rise and may exceed 70, indicating a strong overbought zone.
Analyst view & Expectations
The bulls have taken command of the trend. On the daily time frame, the token has shown a bullish breakout of the consolidation and is now trading above the resistance level. Investors who want to trade can invest now and aim for the 200 EMA in the near future, or they can wait for the token to cross above the 200 EMA for further confirmation of the trend. Intraday traders, on the other hand, have a good opportunity to go long and book profits based on their risk to reward ratio.
According to our current TRON price forecast, the value of TRON is expected to fall by -0.92% and hit $ 0.056 in the next few days. Our technical indicators indicate that the current attitude is Neutral, with the Fear & Greed Index reading 31. (Fear). TRON had 16/30 (53%) green days in the previous 30 days, with 1.88% price volatility. According to our TRON forecast, now is a good time to buy TRON.
Technical Levels
Major support: $0.052
Major resistance: $0.061 & 200 EMA on daily time frame.
Conclusion
On a daily time frame, the token is trading above the demand zone and forming strong bullish candles, allowing investors to maximize their returns. This bullish trend will likely continue and break over the resistance levels in the near future.
Disclaimer: The views and opinions stated by the author, or any people named in this article, are for informational ideas only, and they do not establish the financial, investment, or other advice. Investing in or trading crypto assets comes with a risk of financial loss.