
Prices in the Hedera ($HBAR) market have been very positive over the past day, ranging from $0.045 to $0.467. As of this writing, the bulls were in charge and Hedera’s price has surged by 6.12% to $0.04667.
The $HBAR market is continuing to surge, as seen by the increase in market capitalization and 24-hour trading volume of 6.06% to $1,100,305,595 and 17.3% to $29,387,340, respectively.
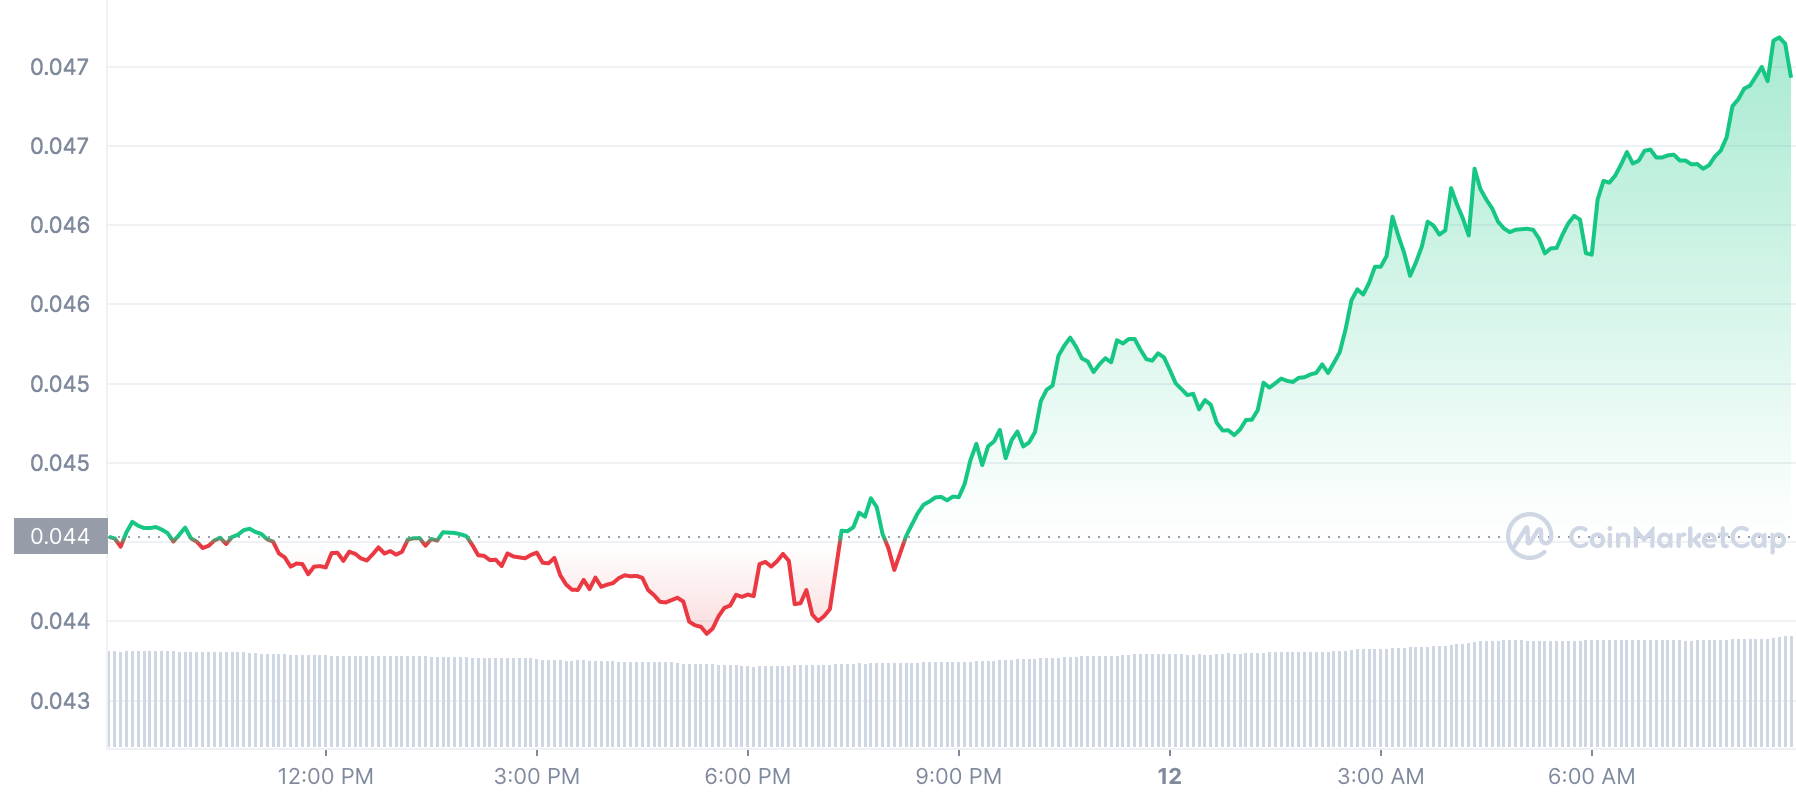
The bulls and bears have battled it out in the market, but the bulls have reclaimed the upper hand and pushed the prices higher to where they are today.
Higher highs and lower lows are seen in the 1-day chart which indicates bullish momentum. The resistance level has been set at $0.048 and the support level has been set at $0.0458. $HBAR is now trading in an upward trend as shown by the upswing of the histogram.
The uptrend began with a breach above the $0.0458 support level, and if Hedera is able to hold the short-term trend, more bullish pressure will probably be applied over the coming hours.
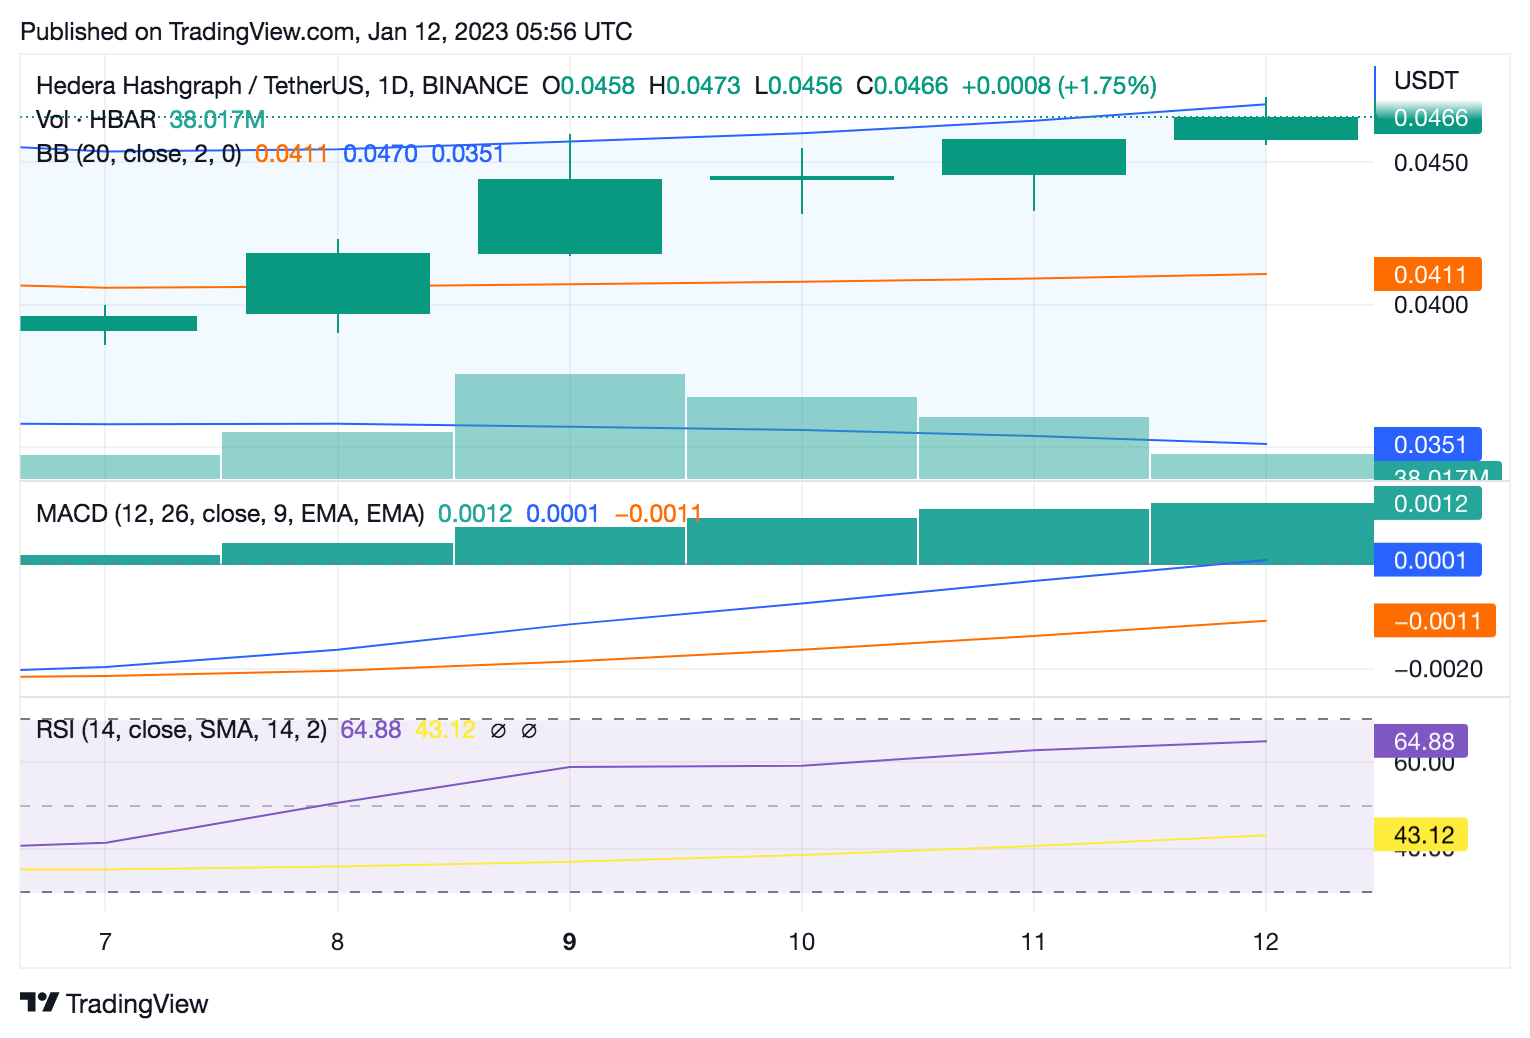
The next support and resistance levels are $0.0468 and $0.048, respectively, and if bullish pressure persists, a break above $0.048 might push prices higher to $0.050. However, if the bears take over and drive the prices below $0.046, the market may experience a robust decline to lower support levels near $0.043 and below.
The RSI indicates that the $HBAR market is marginally bullish as it is trading at value of 0.0466 and a northward trend is continuing, and as a result, the price is anticipated to increase further in the near term.
The fact that all of the daily technical indicators are positive indicates that $HBAR is most likely to keep moving north for the next couple of hours. The moving average (MA) number, is at $0.0421.
We can see that the relative strength index (RSI) is currently sitting at 73.95, indicating that the market is moving to the overbought region thus giving insight that the buyers are in control of $HBAR’S market. The MACD is in the positive zone, indicating that buying pressure is still there.
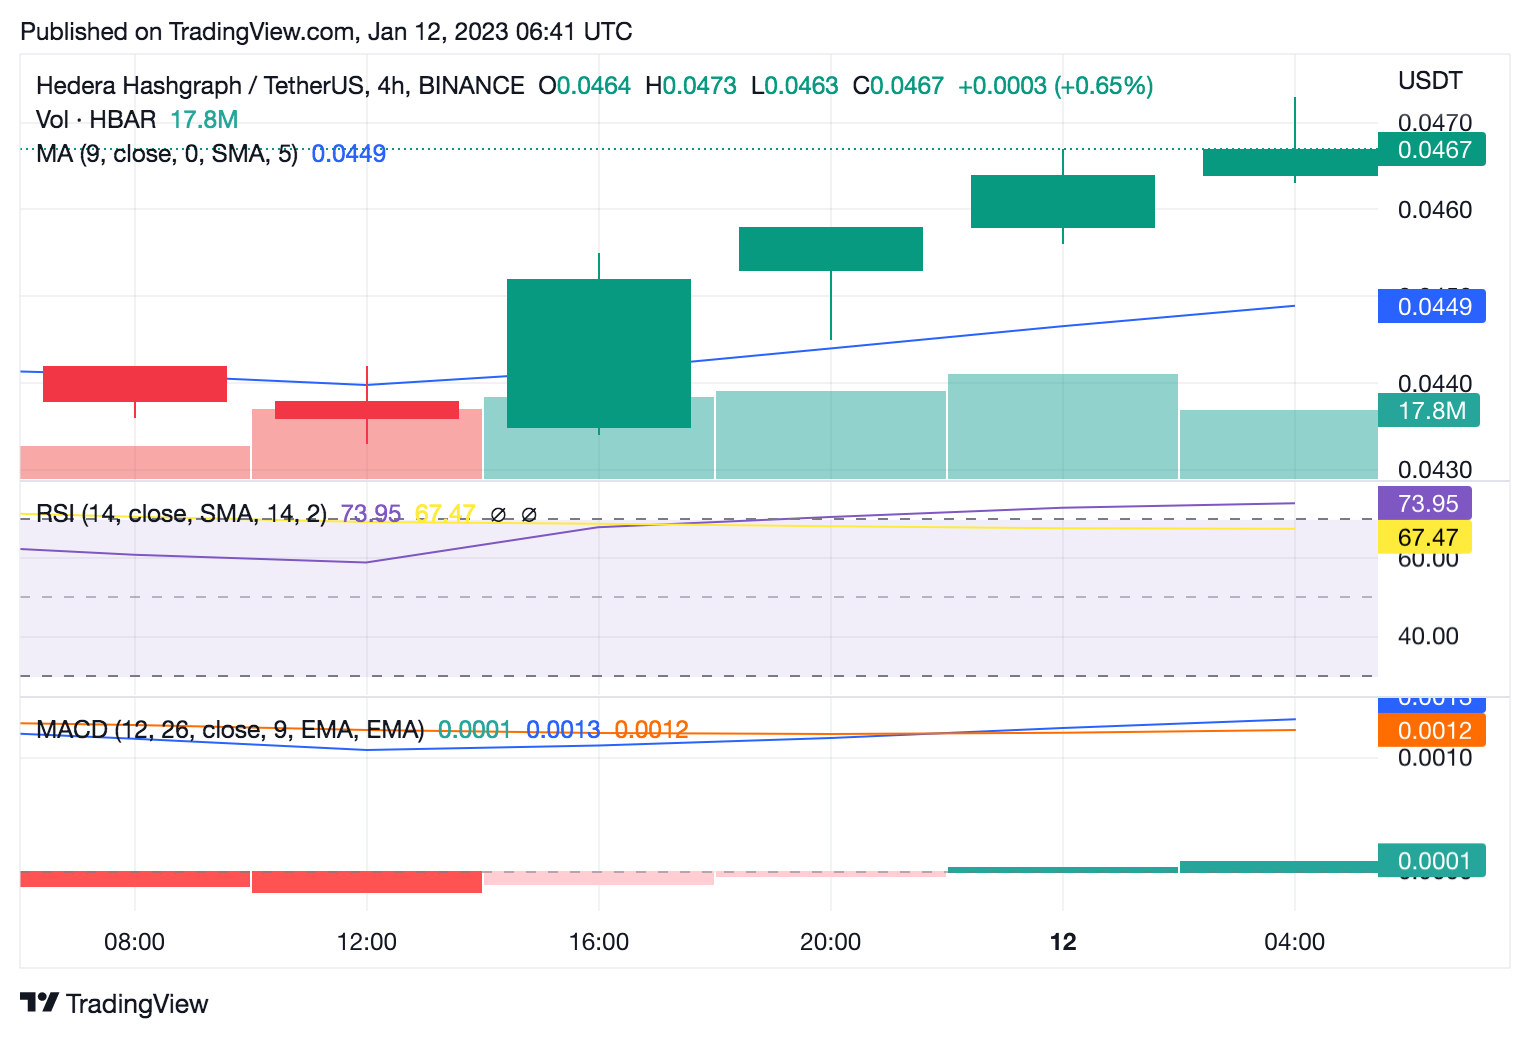
The bulls have fully taken grip of the market on the 4-hour chart as we can see the green candlesticks are bulging moving northwards. The MACD also is in the positive region as it sits at 0.0012.
Bullish momentum can also be seen on the $HBAR 4-hour price chart, where the coin is currently trading above its moving average (MA) value of $0.0449. Overall, it appears likely that $HBAR will continue its upward trend in the near future given the state of the market and technical analysis.
Disclaimer: The views and opinions, as well as all the information shared in this price analysis, are published in good faith. Readers must do their own research and due diligence. Any action taken by the reader is strictly at their own risk, Coin Edition and its affiliates will not be held liable for any direct or indirect damage or loss