Kusama (KSM) offers an interoperable and scalable platform to blockchain developers. Developers use Kusama, to design and develop blockchain applications. Kusama is designed to provide a testbed to the developers trying to innovate with blockchain technology. Let us look at the technical analysis of KSM.
Past Performance
On September 13, 2021, KSM started trading at $434.89. As of September 19, 2021, the closing price of KSM was $401.14. Thus, in the past week, the KSM price has decreased by roughly 7.6%. In the last 24 hours, KSM has traded between $375.50-$416.94.
https://www.tradingview.com/x/NsNlTv3v/
KSM Technical Analysis
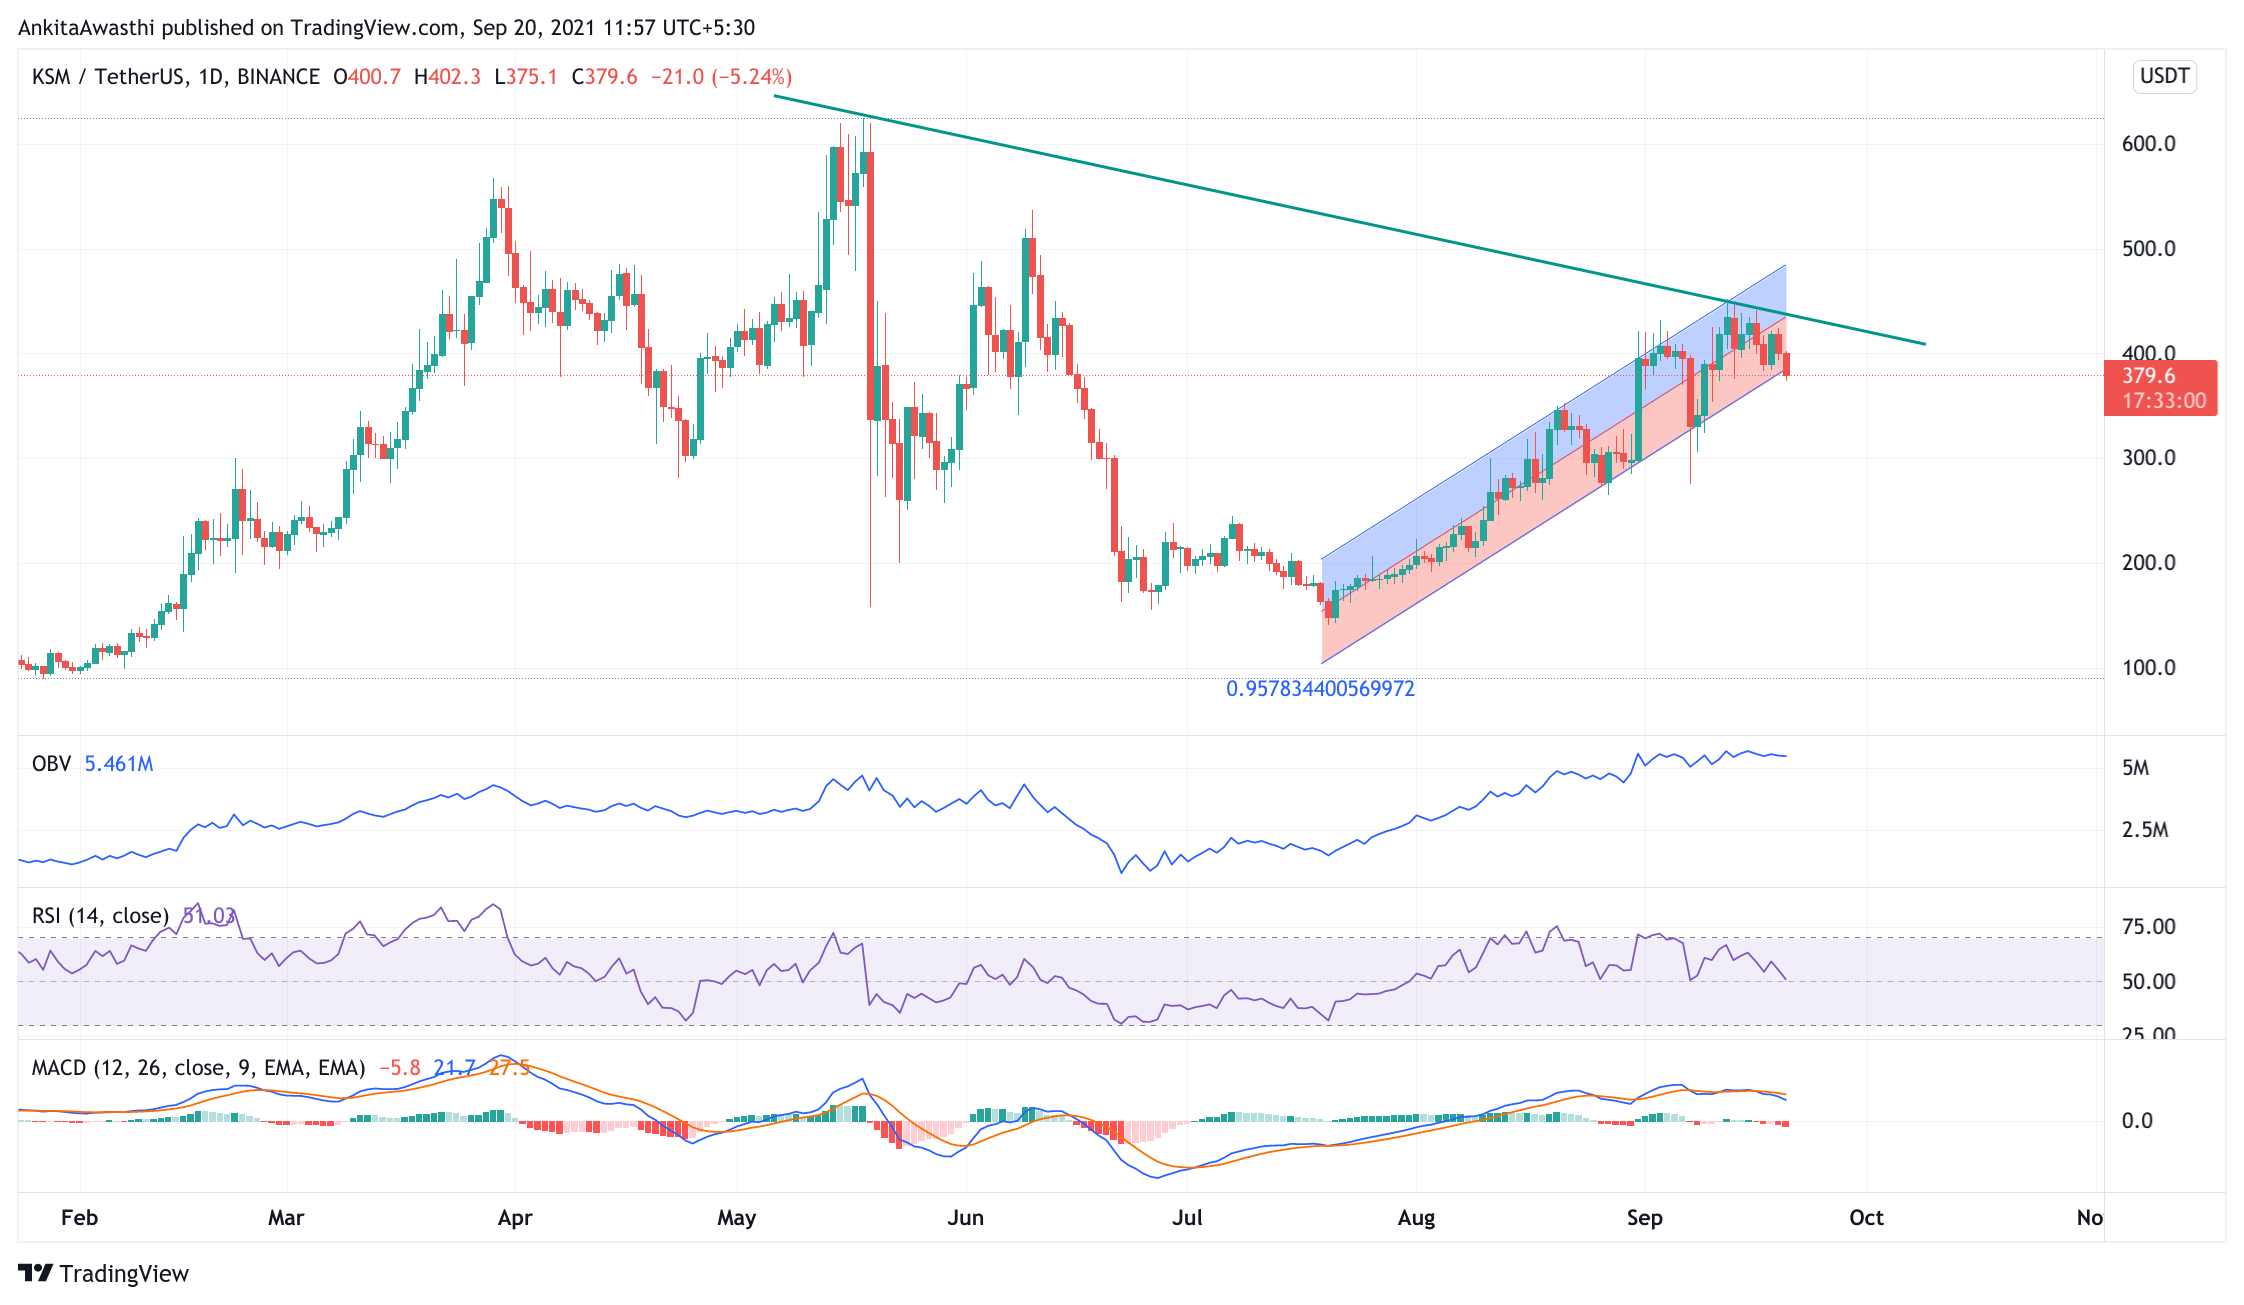
Currently, KSM is trading at $379.68. The price has decreased by approximately 8.79% from the opening price.
The MACD and signal lines are in the positive zone. However, a bearish crossover by the MACD line over the signal line has occurred. Thus, the overall market momentum is bearish, and we can expect a price pullback.
The OBV indicator is in a constant sideways trend. Thus, indicating that the investor's interest isn't losing, and they are holding on to the coin. Hence, the correction might be due to the market sell-off and profit booking.
The RSI indicator is at 49%. It has just fallen from the 58% mark, making a bearish divergence. Thus, selling pressures are slowly mounting. Hence, we can expect the price to fall again for a few hours.
In short, when we look at all three oscillators, we can say that the price may continue to fall. However, we cannot rule out the possibility of a trend reversal. We have to wait and watch to see if an intermittent price fall is a correction or the beginning of a downtrend trend.
Day-Ahead and Tomorrow
The KSM price has fallen below the Fibonacci pivot point of $422.13. As some of the oscillators have shown bearish signals, we can expect the price to fall below the first Fibonacci pivot support level of $402.69 soon.
However, if the bulls get active and take the price up. We can expect it to break the immediate resistance level at $402. A breakout from this level will highlight the $422 resistance level. Thus, traders can go long from this position.