The Fantom (FTM) price is inching closer to the resistance line of a descending wedge. Due to bullish readings from the weekly and daily time frames, a breakout from the wedge is the most likely scenario.
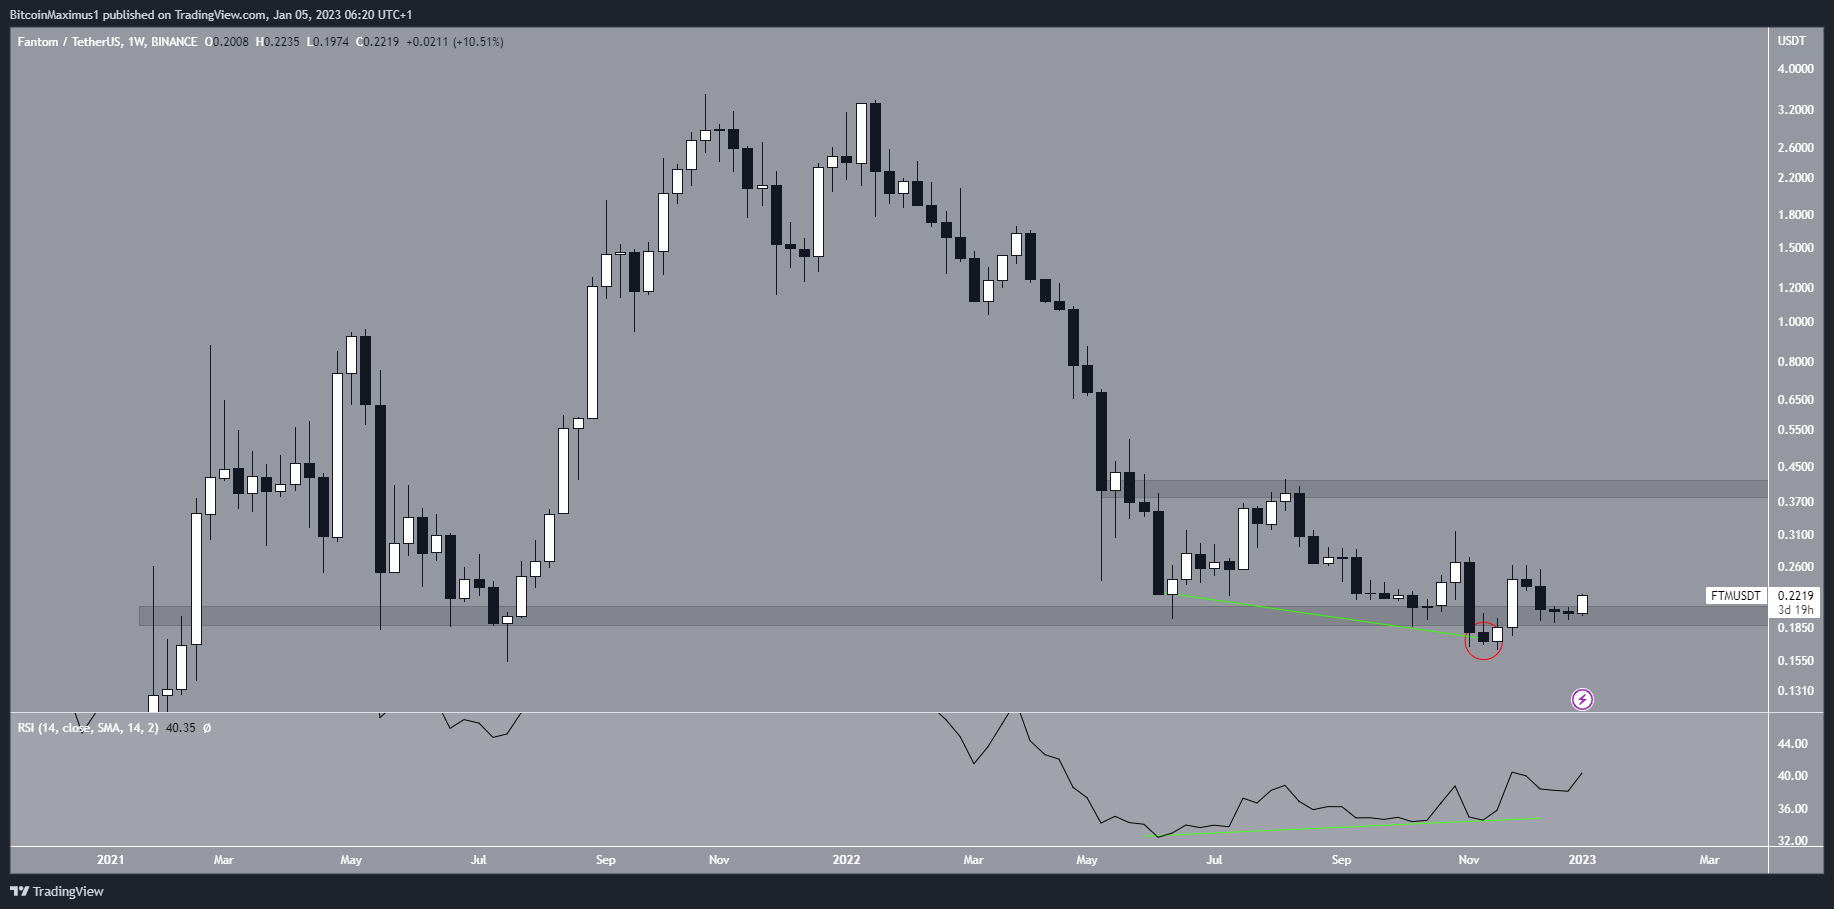
The Fantom price has fallen since reaching a maximum of $3.48 in Oct. 2021. The downward movement led to a minimum price of $0.16 in Nov. 2022. This was the lowest price in nearly 500 days.
Initially, this downward movement caused a breakdown from the $0.20 horizontal support area, which had been in place since the beginning of 2021. However, the breakdown turned out to be a deviation (red circle) since the Fantom price reclaimed the area shortly afterward. Such deviations are considered bullish movements since bears did not have enough strength to push the price down. As a result, the price action from the weekly time frame is bullish.
The bullish signs do not stop there. The weekly RSI has generated a significant amount of bullish divergence (green line) and is increasing toward 50.
As a result, the Fantom price prediction for Jan. and beyond seems to be bullish. In this case, the main resistance area would be at an average price of $0.40. Conversely, a weekly close below the $0.20 support area would invalidate this bullish hypothesis.

Fantom price prediction for Jan: Breakout Could Accelerate Upward Movement
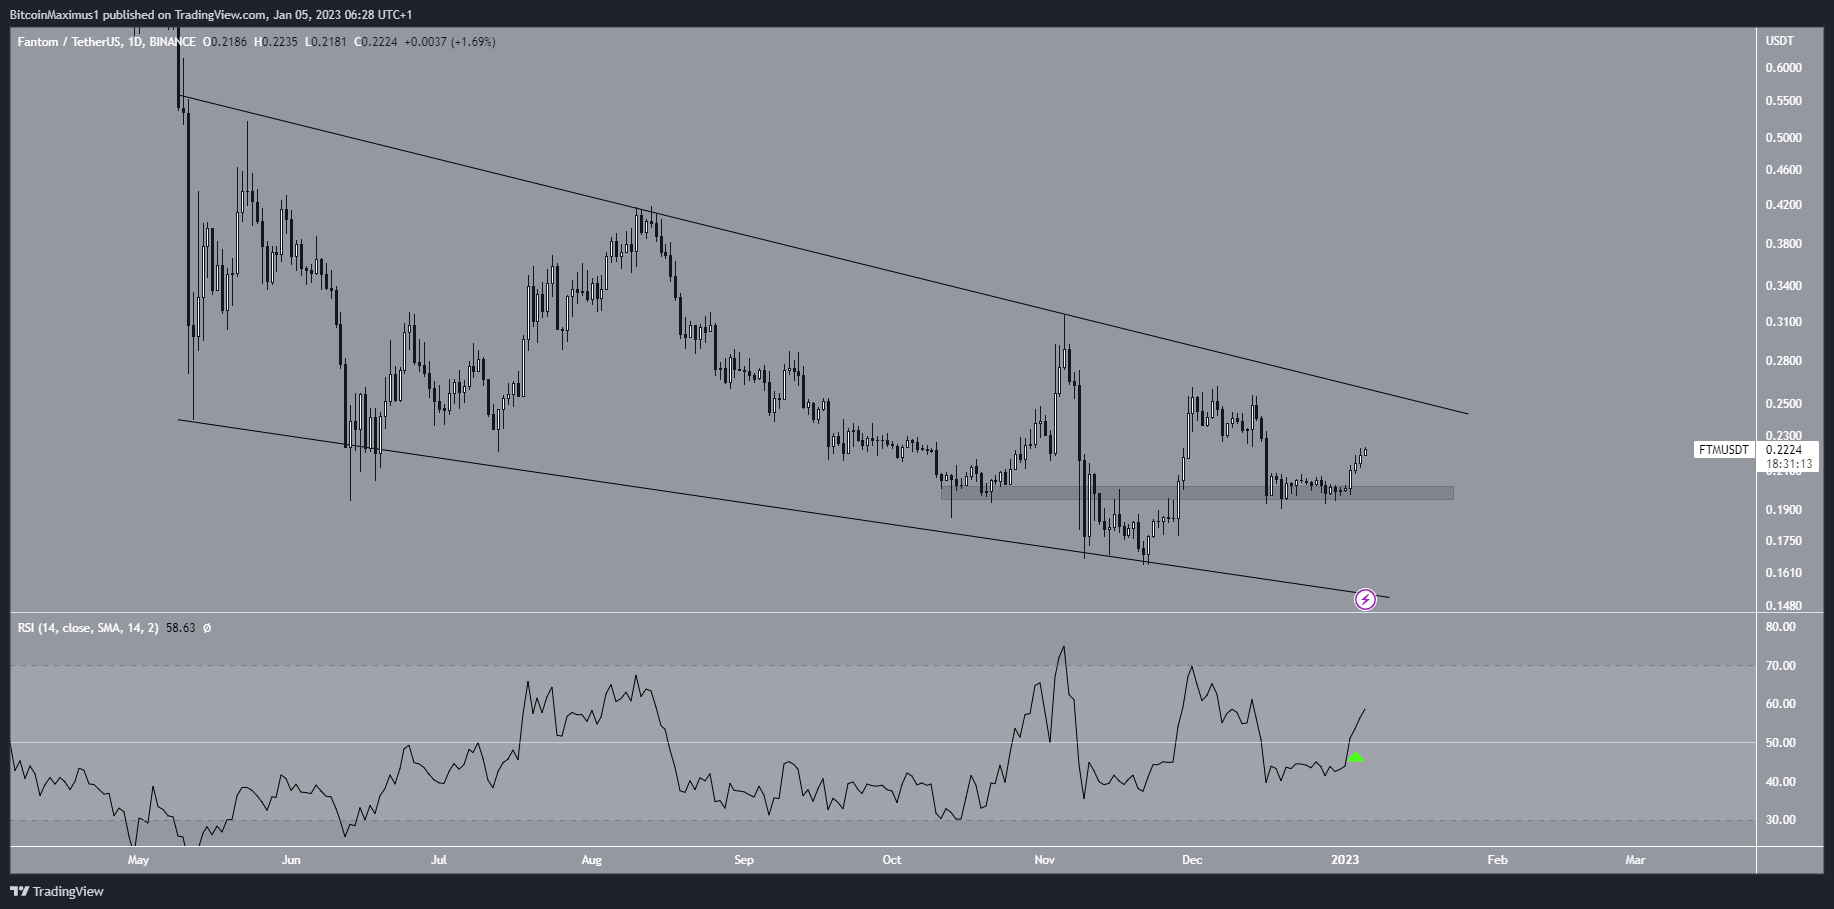
The technical analysis from the daily time frame aligns with the possibility of a breakout. The main reason for this is that the FTM price is trading inside a descending wedge, which is considered a bullish pattern. Moreover, the price is above the middle of the wedge and moving toward its resistance line.
Next, the daily RSI has moved above 50 (green icon), another sign of a bullish trend. As a result, a breakout from the wedge is the most likely scenario. If that occurs, the Fantom price could increase toward the $0.40 long-term resistance area.
As outlined previously, a fall below $0.20 would invalidate this bullish FTM price analysis. In that case, the support line of the wedge near $0.15 would be expected to provide support.

To conclude, the most likely FTM price forecast is a breakout from the wedge in the daily time frame and an increase toward the $0.40 resistance area. A close below $0.20 would invalidate this bullish hypothesis.
 beincrypto.com
