The Crypto.com ($CRO) price has broken down from a crucial horizontal support area. The trend is considered bearish until it reclaims it.
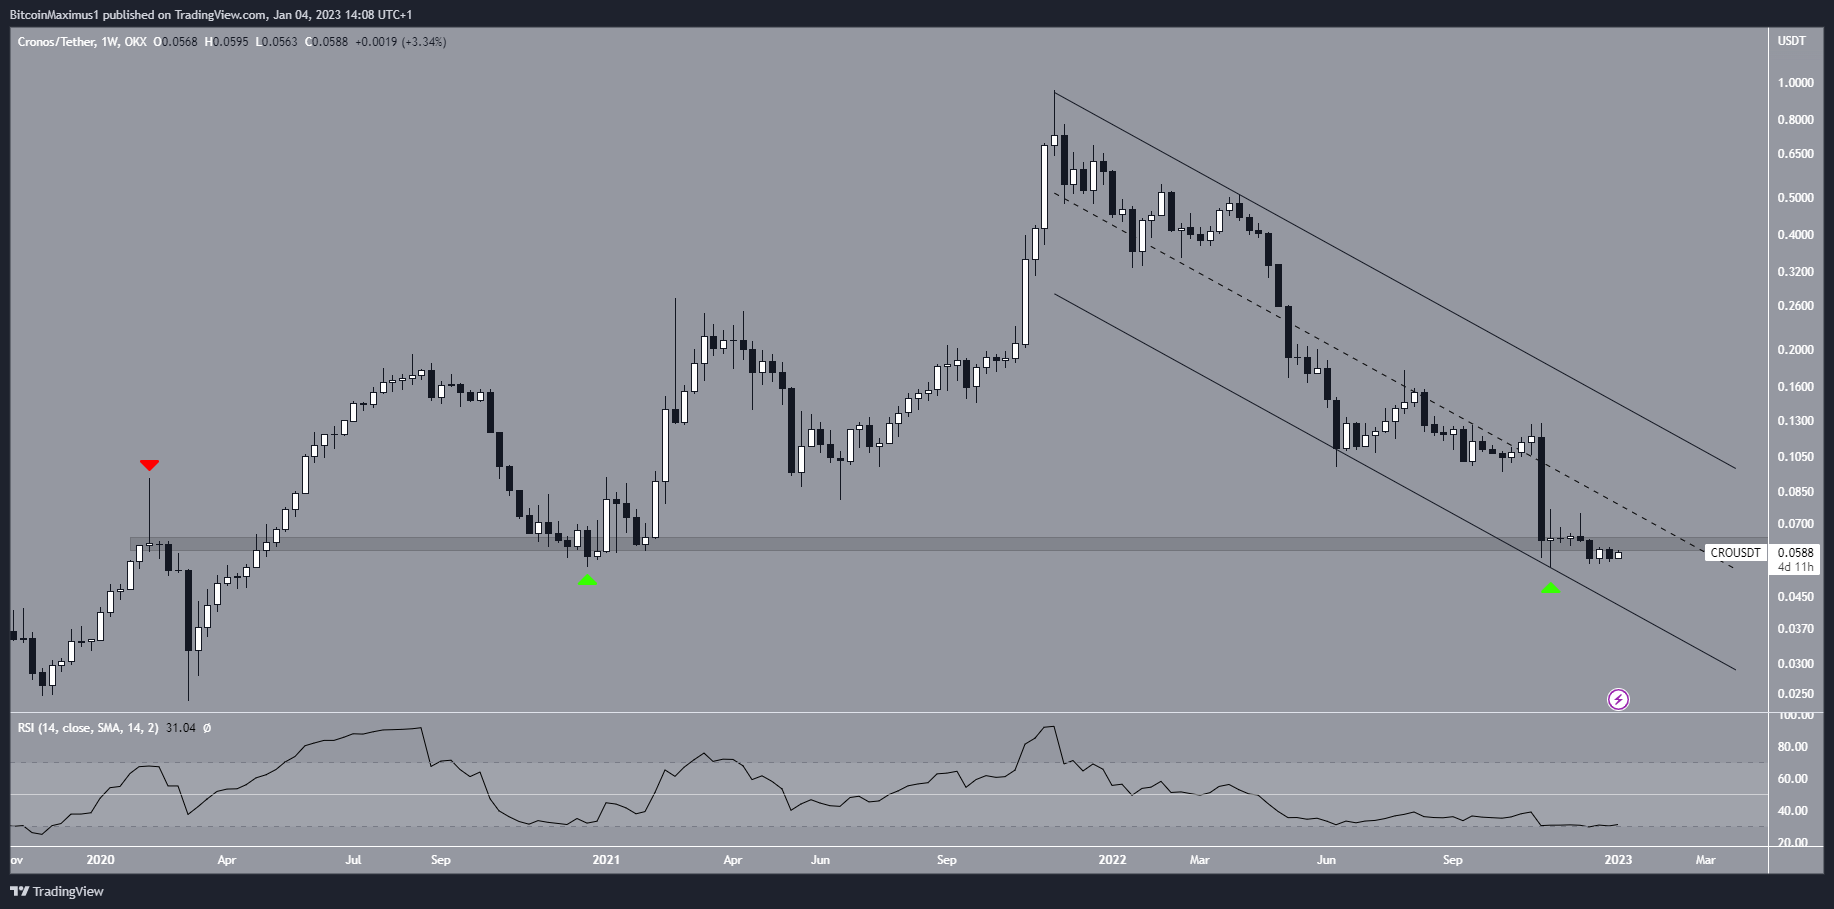
The $CRO price has decreased inside a descending parallel channel since reaching an all-time high of $0.955 in Nov. 2021. The downward movement led to a minimum price of $0.053 in the following Nov.
The low validated the channel’s support line and seemingly initiated a bounce (green icon). However, the $CRO price was unsuccessful in maintaining it.
Next, $CRO broke down from the $0.062 horizontal support area. This is a crucial area since it had previously acted as both resistance and support (red, green icons) since early 2020.
As a result, until the $CRO price reclaims it, the trend is considered bearish. If it does not, the continuation of the downward movement toward the channel’s support line at $0.037 is the most likely price forecast.
The weekly RSI is bearish, supporting the possibility of a decrease. The indicator is falling, is below 50 and has not generated bearish divergence.
As a result, as long as the price is trading below the $0.062 horizontal resistance are, the $CRO price forecast is bearish.

$CRO Price Trades in Bearish Pattern
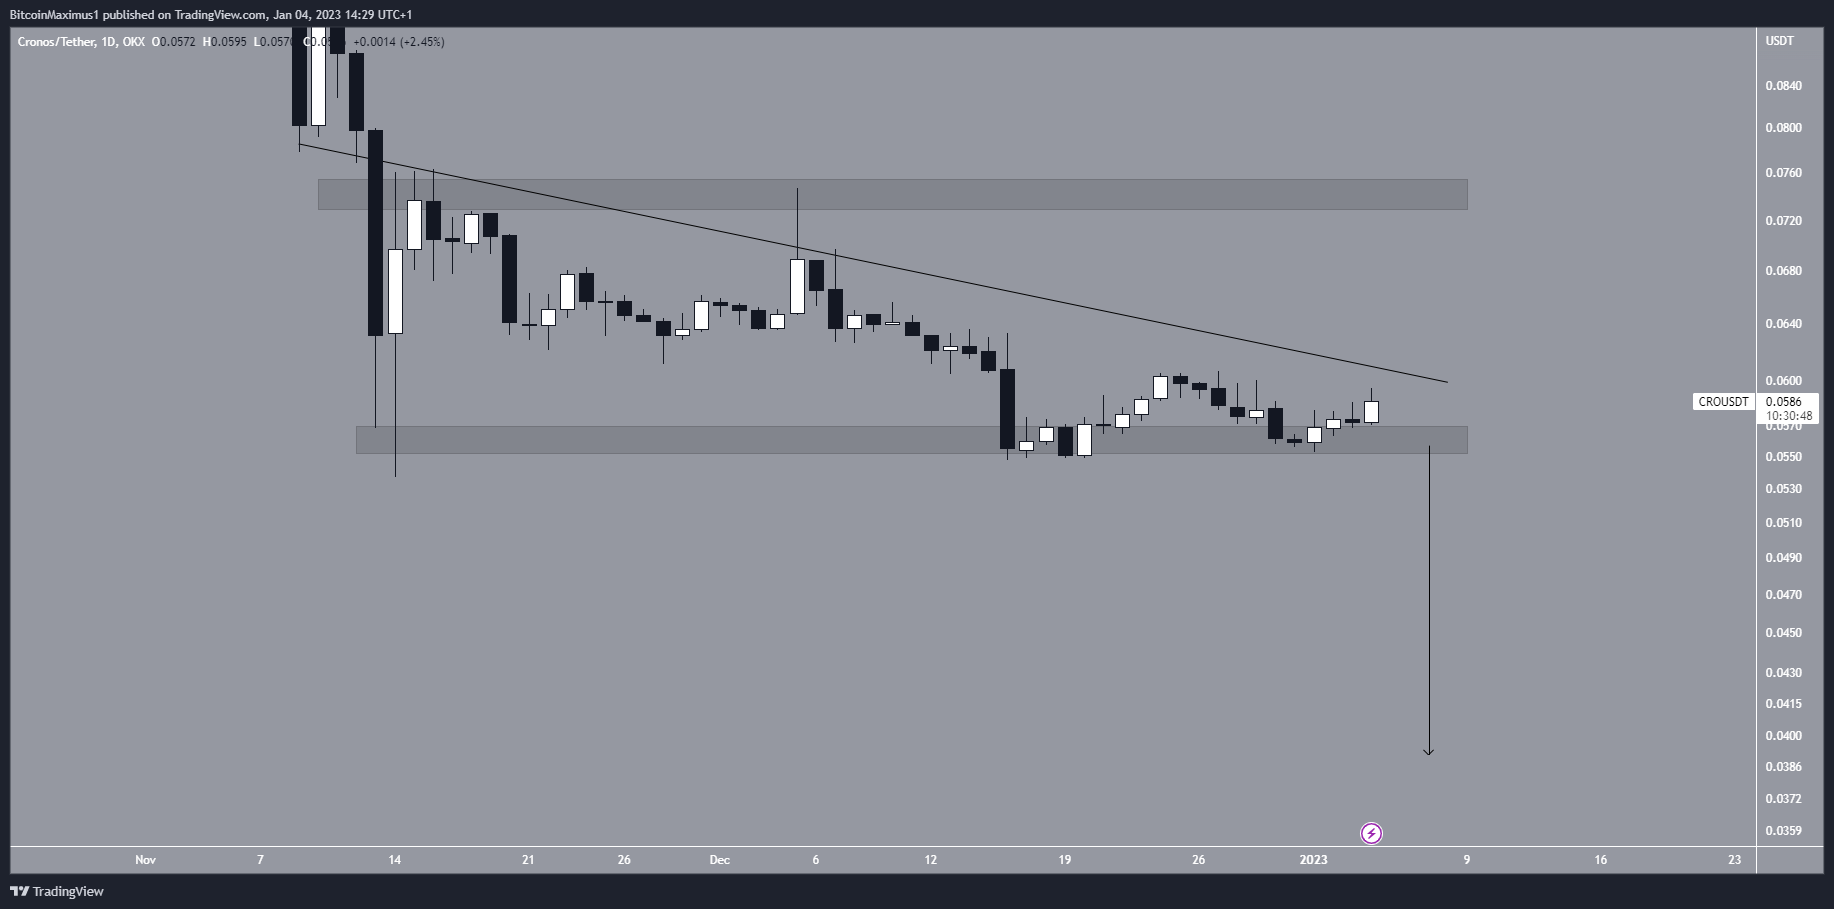
The technical analysis from the daily chart shows that $CRO has followed a descending resistance line since Nov. 13. When combined with the $0.056 horizontal support area, this created a descending triangle, which is considered a bearish pattern.
A breakdown that travels the entire height of the pattern (black arrow) would take the $CRO price to $0.039. This would align with the support line of the long-term channel.
On the other hand, a breakout above the resistance line could take $CRO to $0.075. Since this would mean that the price reclaims the $0.062 area, it would also have bullish implications for the long-term trend.

To conclude, whether the Crypto.com price breaks out or down from the descending triangle will likely determine the direction of the future trend. Due to the bearish weekly readings, a breakdown is more likely.
 beincrypto.com
