- STX price formed a bullish reversal candle from the yearly demand zone at $0.200
- STX price might approach 50 day EMA in January 2023
Stacks Crypto Price is trading with the mild bullish cues and bulls were trying to defend the recent lows. As per coin glass, In the last 12 hours, STX long and short ratio stood at 0.63 denotes sellers are more as compared to buyers and it will be not easy for bulls to continue the upside momentum.Currently, STX/USDT is trading at $0.216 with the intraday gains of 0.47% and 24 hour volume to market ratio stood at 0.0295
Will the bulls be able to reverse the trend ?

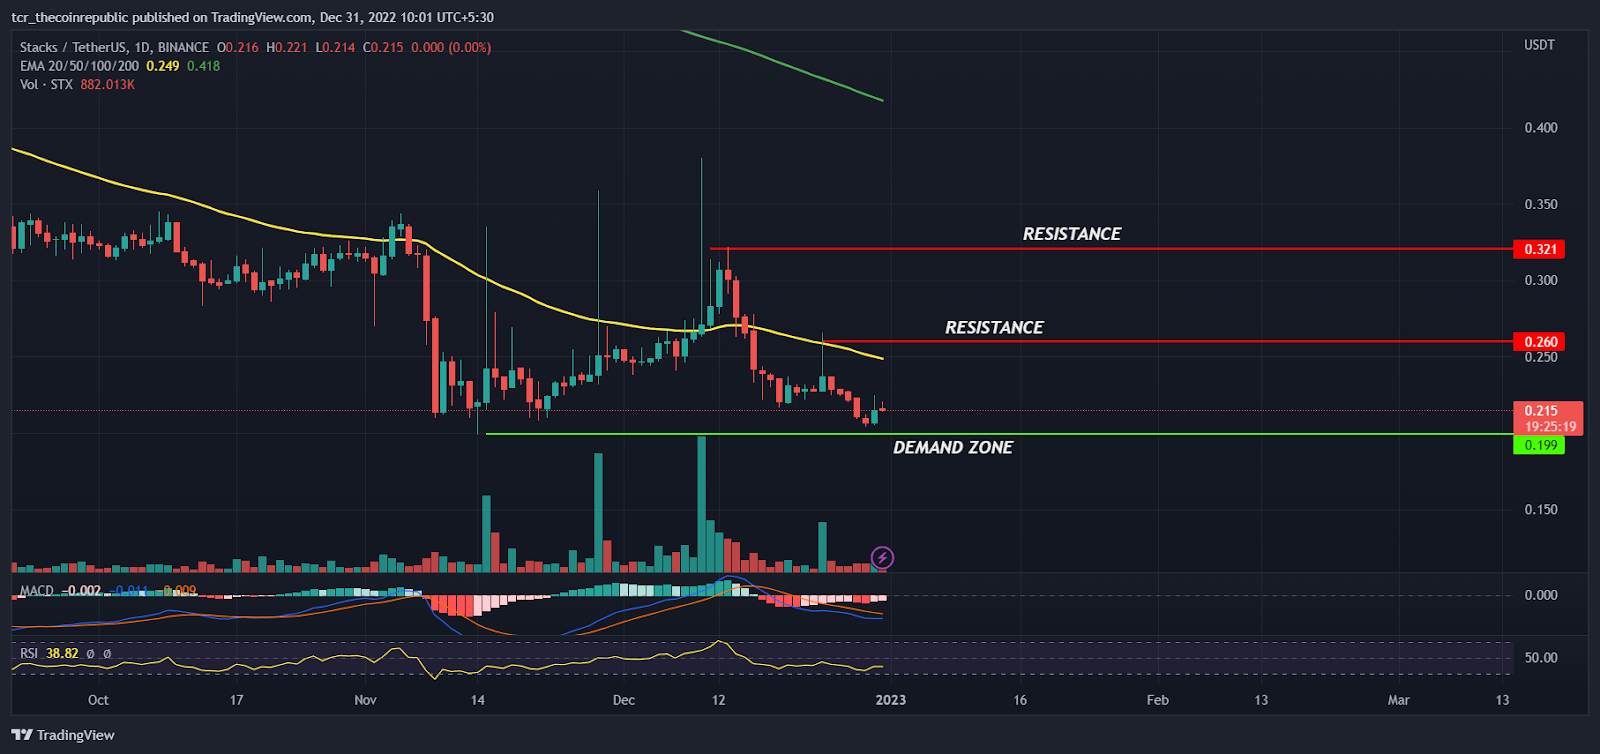
On a daily time frame, STX prices have been in a downward trend for a quite longer time but buyers have tried multiple times to reverse the trend in the favor of bulls. In November, STX got negatively affected due to an unfavorable environment in the whole crypto industry and hit a yearly low at 0.199 while forming a bullish hammer candle. However, after a little bit of consolidation in lower levels bulls gained some positive momentum and recovered almost 60% from the lows and faced a resistance at $0.321.
Later, bulls were unable to hold the prices into higher levels and prices slipped back to its yearly demand zone. As of now, prices were forming a bullish reversal candle from the support level and likely to see a pull back rally in coming days.The 50 day EMA (yellow) at $0.249 will act as an immediate hurdle in coming days and the next hurdle will be at $0.321. On a lower side, if prices slipped below $$0.199 bear may drag the prices further down towards $0.150 level. The MACD line is still below the signal indicating prices are still into bear grip whereas RSI at 38 reversing upside from the oversold level.
Bulls challenging the strong bears

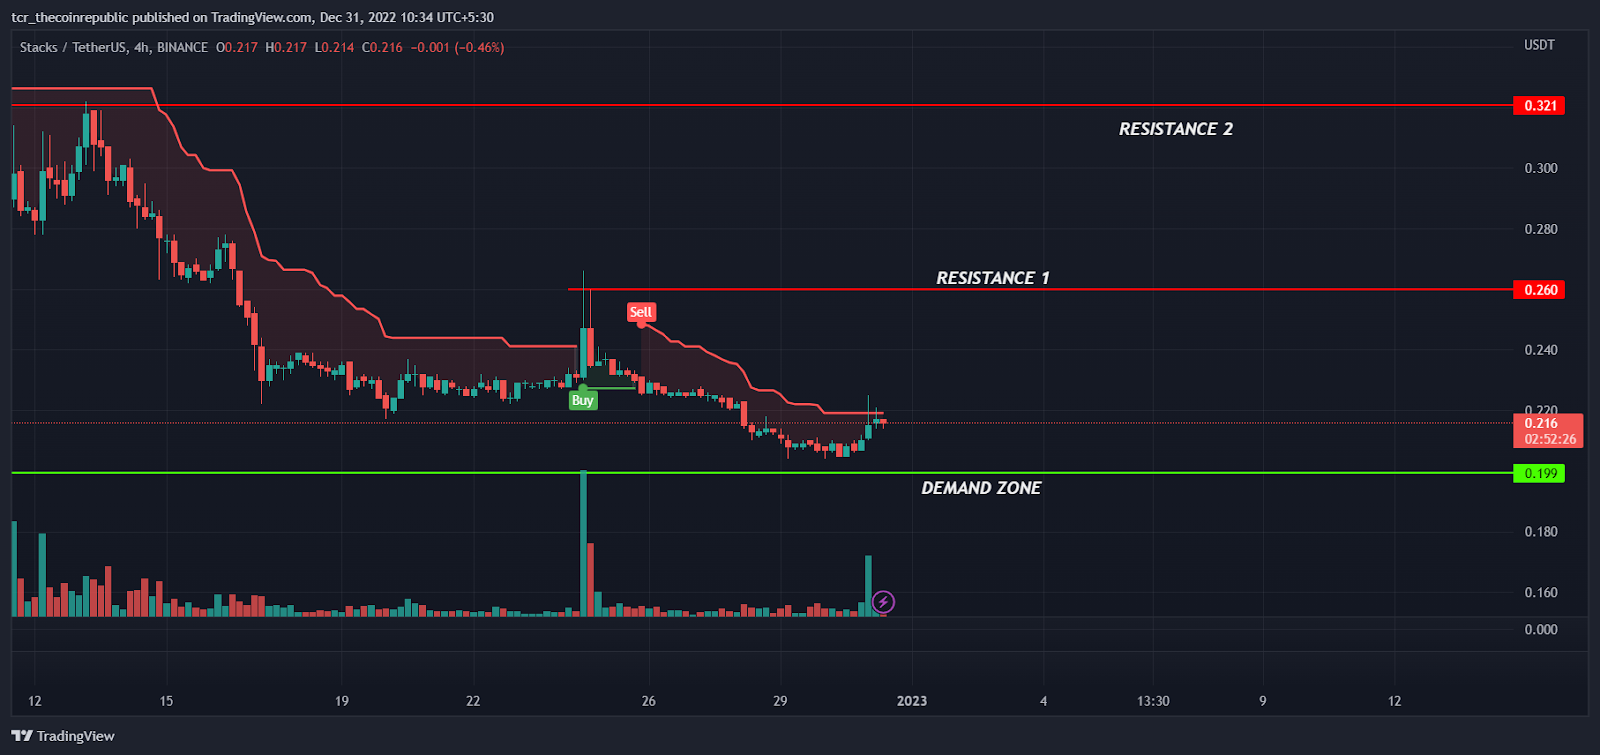
On a lower time frame, Stacks prices are showing initial signs of an upside pullback rally but it will be not easy for buyers to continue the upside momentum. From the mid of December prices were continuously falling while forming lower lows swings indicating strong bears are active on higher levels and minor spikes are used by sellers to create short positions on higher levels. The supertrend indicator had generated a sell signal indicating the short term trend may remain weak but bulls were attempting to break out of the red line and reverse the trend in the favor of bulls.
Summary
Stacks Prices had formed a bullish reversal candle from the support zone indicating responsive buyers were trying to defend the recent lows but bulls need more upside days to confirm the short term upside trend reversal. As per technical indicators, prices are lacking momentum on the down side and might trade sideways in coming weeks.
Technical levels
Resistance levels : $0.260 and $0.321
Support levels : $0.199 and $0.150
Disclaimer
The views and opinions stated by the author, or any people named in this article, are for informational ideas only, and they do not establish financial, investment, or other advice. Investing in or trading crypto assets comes with a risk of financial loss.
 thecoinrepublic.com