The Ocean Protocol (OCEAN) price has given a strong bullish reversal signal in the weekly RSI. The Aave (AAVE) price created a double bottom pattern. The Monero (XMR) price reclaimed an important horizontal level.
These three cryptocurrencies have decreased massively since their respective all-time highs. However, all three have relatively bullish-looking setups. Due to their massive decrease, they have a tremendous risk-to-reward ratio in case a bullish reversal occurs.
OCEAN Gives Bullish RSI Signal
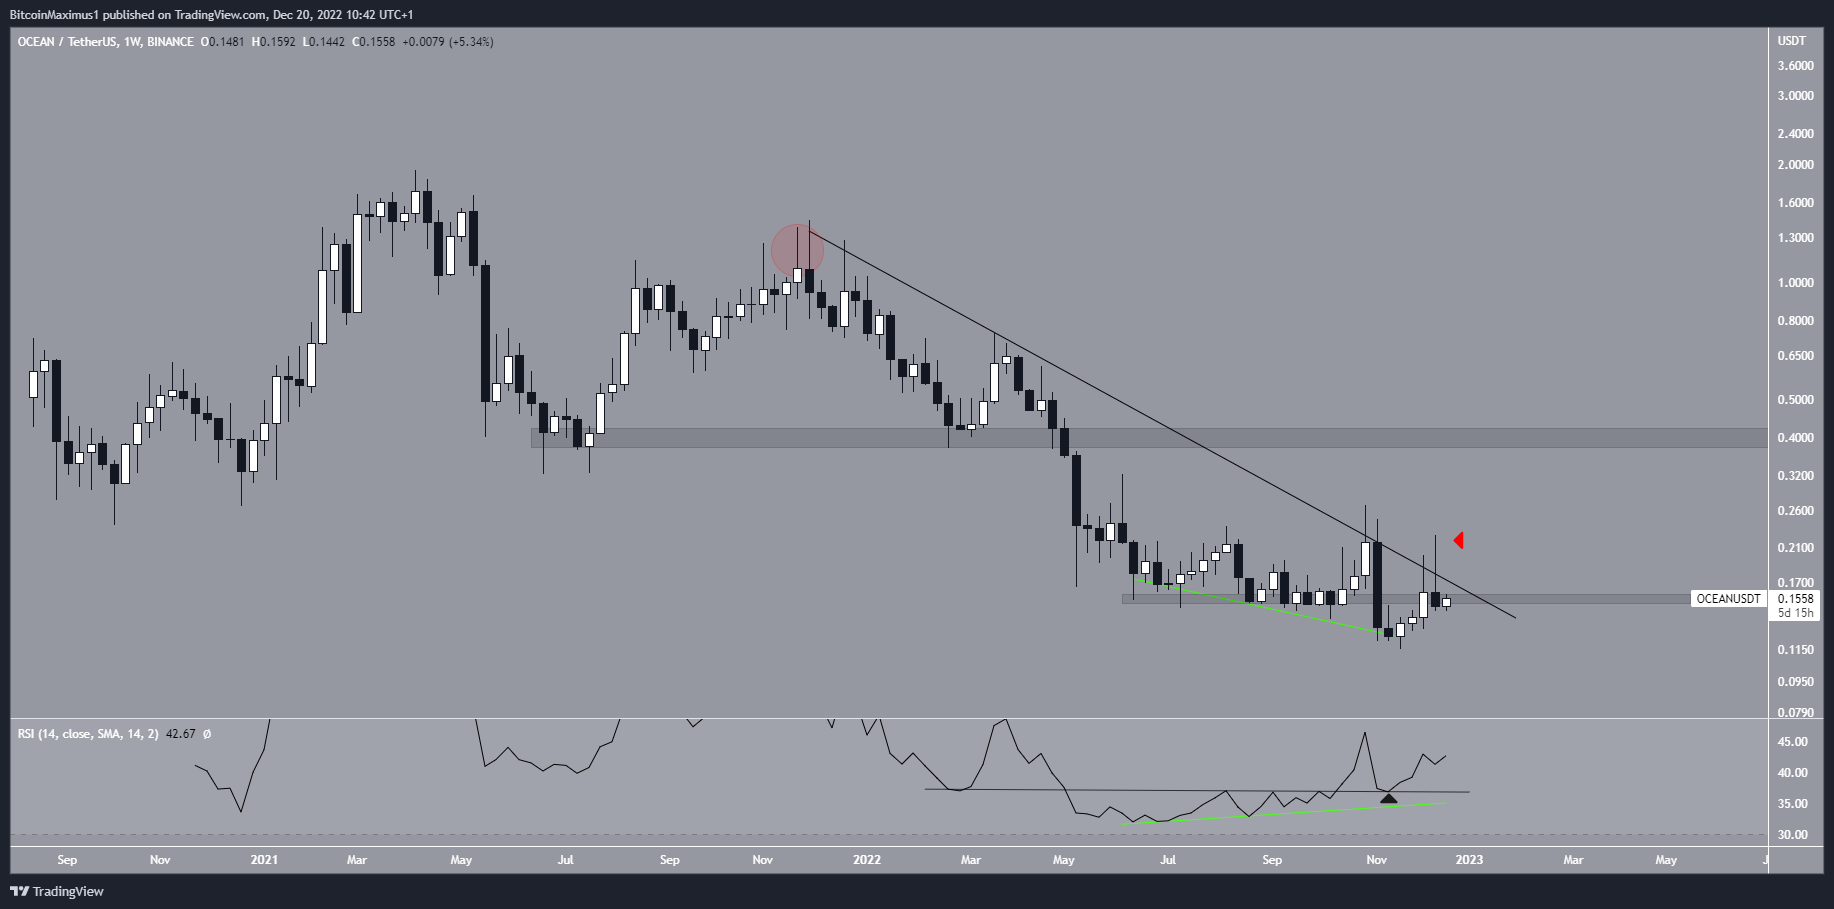
The Ocean Protocol (OCEAN) price has fallen since reaching an all-time high of $1.94 in April 2021. It created a lower high in Nov. 2021 (red circle) and fell underneath a descending resistance line afterward.
After reaching a low of $0.115 in Nov. 22, the OCEAN price began the current upward movement. A very interesting development comes from the weekly RSI, which generated bullish divergence (green line) and completed a swing failure pattern (black line & icon) afterward. This is a bullish sign that often precedes bullish trend reversals.
However, the OCEAN price failed to break out from the resistance line and created a long upper wick instead (red icon). It is now trading below the resistance line and the $0.155 area.
Reclaiming the $0.155 area and breaking out from the descending resistance would be a significant bullish development since it would confirm the bullish reversal. If this occurs, the OCEAN price could increase toward the next resistance at $0.40.
Conversely, a close below $0.115 could lead to new lows.
AAVE Creates Double Bottom
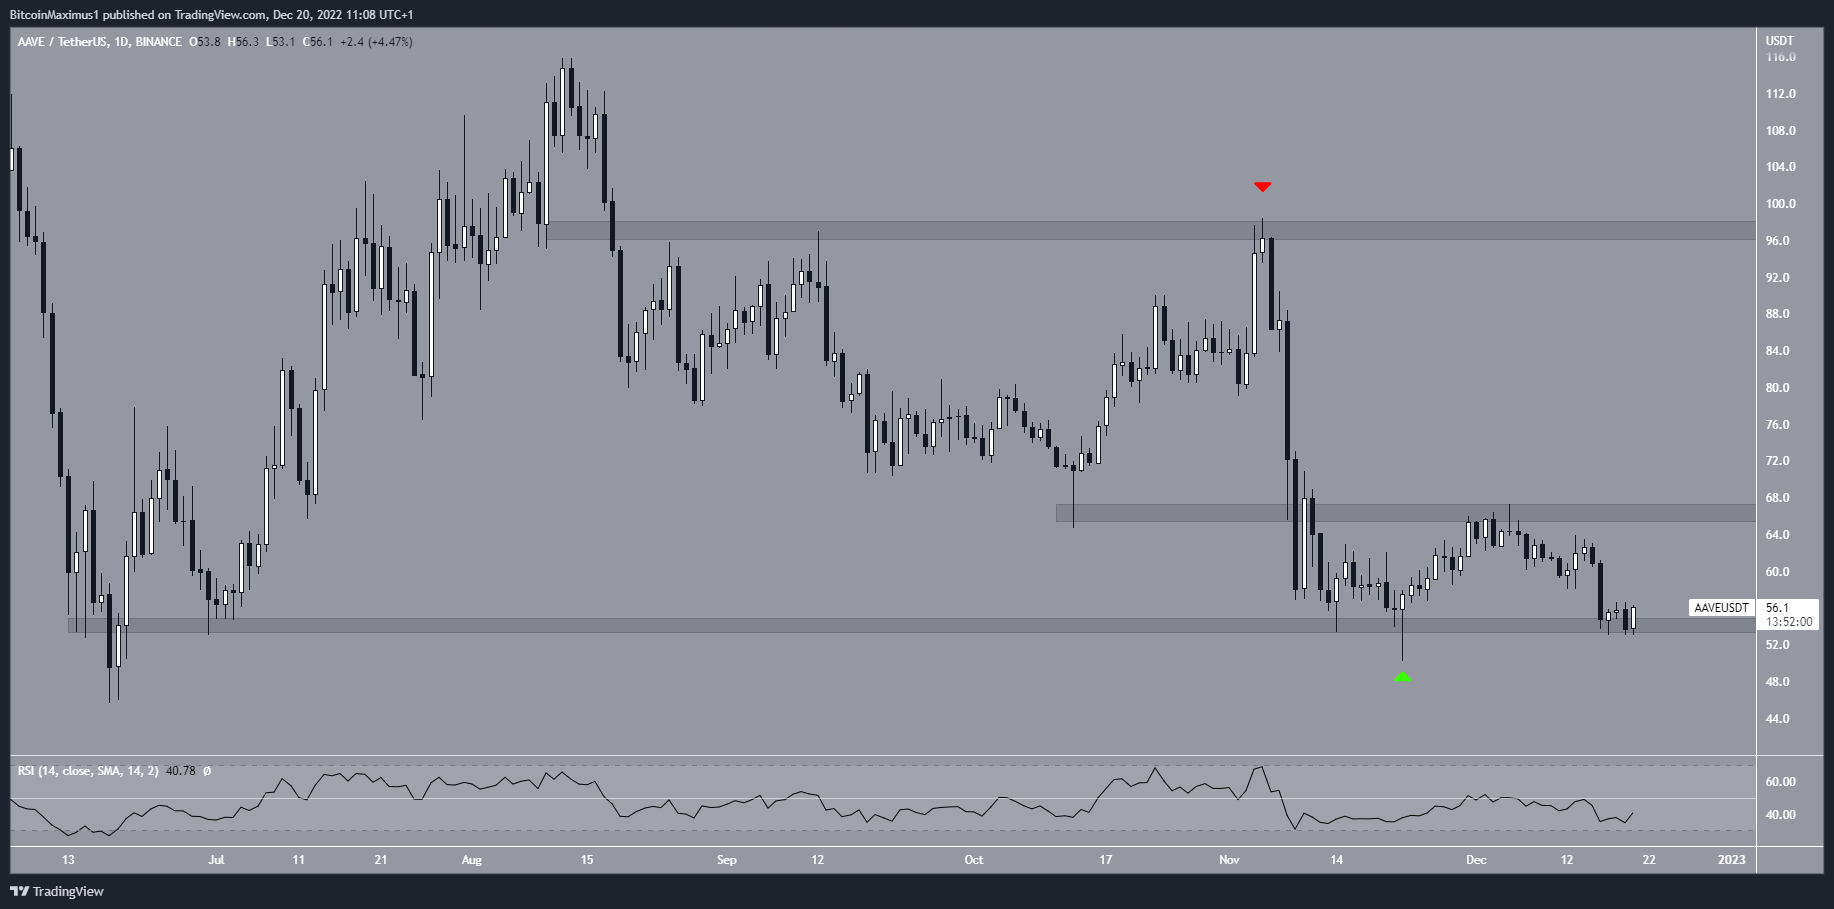
The AAVE price has fallen since reaching a high of $115.80 in Aug. 11. It created a lower high on Nov. 5 before accelerating its rate of decrease (red icon). The AAVE price reached a low of $50.20 in Nov. 22 before bouncing and creating a bullish hammer candlestick (green icon).
This validated the $54 horizontal support area. After a failed upward movement, the AAVE price returned to the same level on Dec. 20, creating a double bottom pattern. However, the pattern has yet to be confirmed and has not been combined with bullish divergence in the RSI.
Moving above the $66.50 area would confirm the double bottom pattern and likely lead to an increase towards $95. Conversely, reaching a daily close below the $54 support area would lead to a new yearly low.
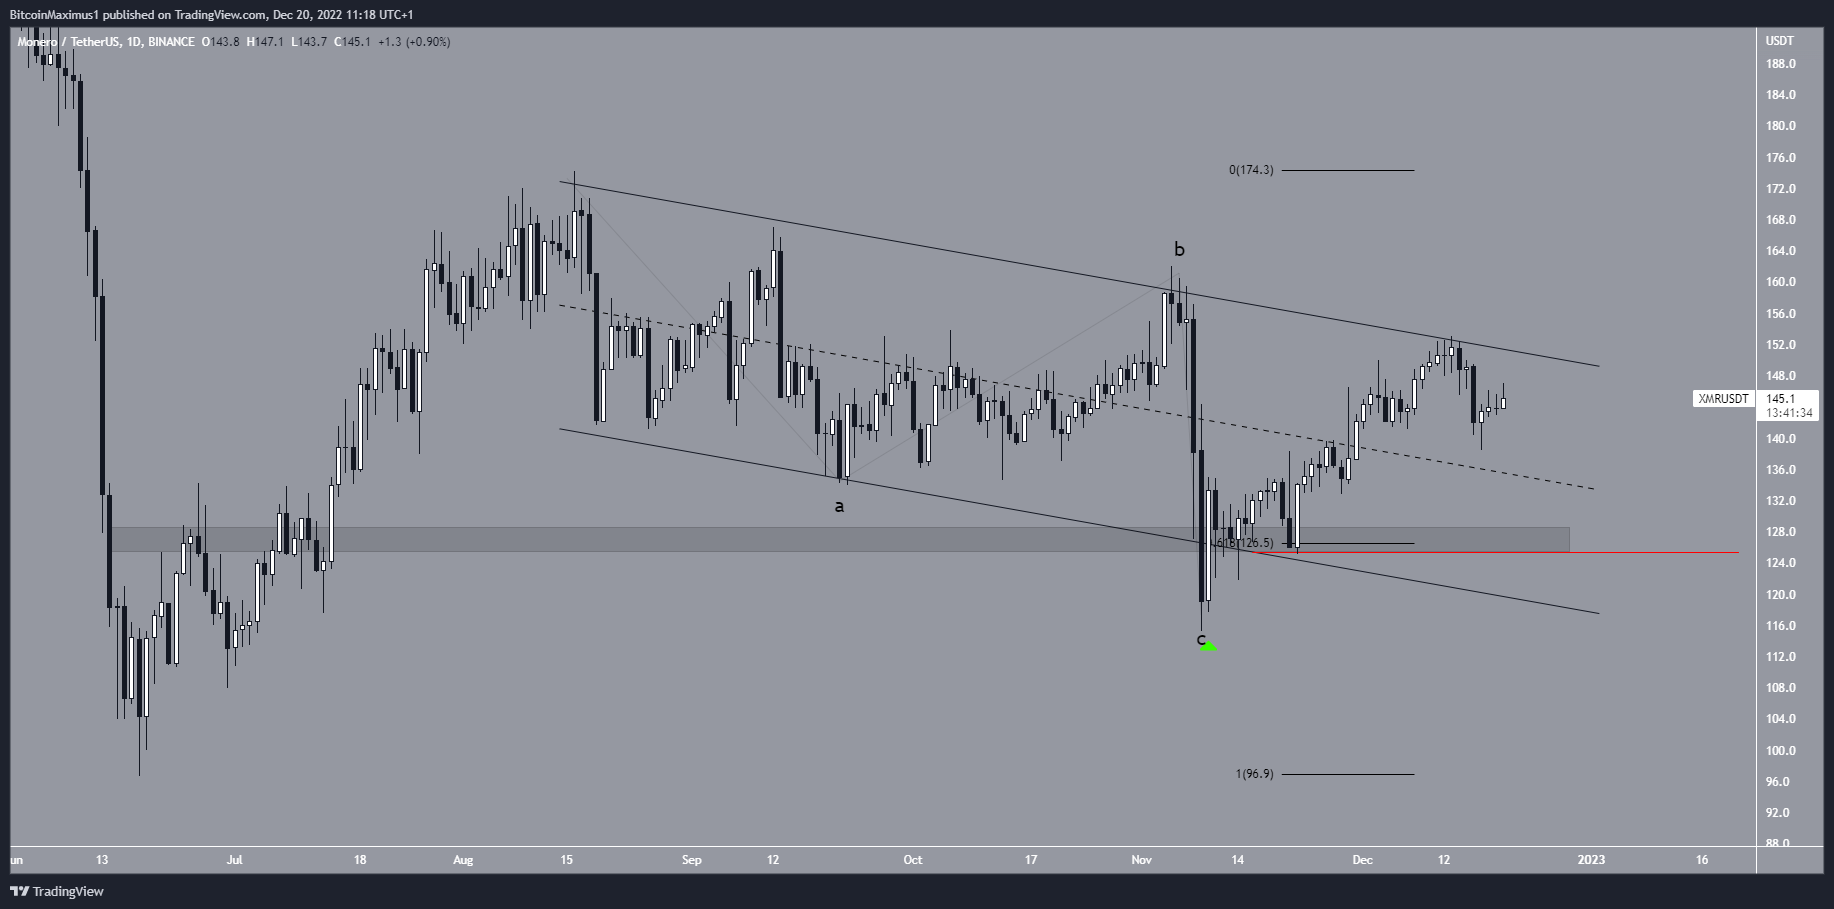
XMR Gives Hope For Early Cryptocurrencies
Monero is one of the oldest cryptocurrencies, launching in 2014. The XMR price is trading inside a descending parallel channel. Such channels usually contain corrective movements, meaning that an eventual breakout from them is expected.
The XMR price seemingly completed an A-B-C structure inside it, in which waves A:C had a 1:1 ratio. The bounce after the C wave low (green icon) validated the channel’s support line and reclaimed the $126.50 horizontal area, which is the 0.618 Fib retracement support level.
Currently, the XMR price is in the process of breaking out from the channel’s resistance line. If successful, this could accelerate the upward movement toward $200. On the other hand, falling below the $125 level (red line) would invalidate this bullish setup.