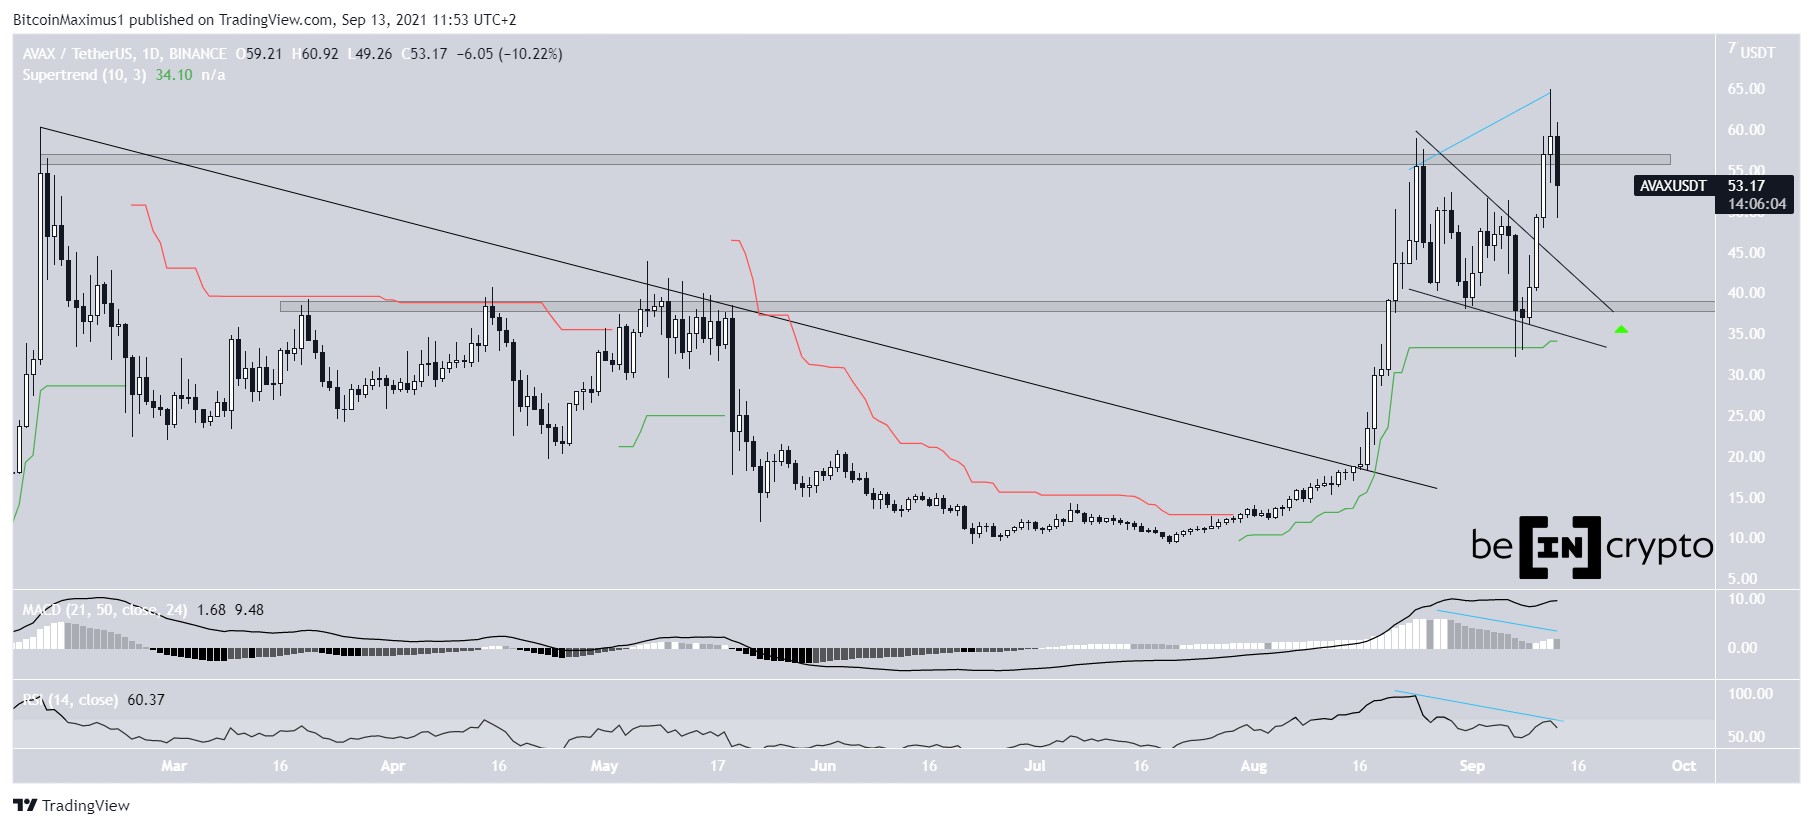
Avalanche (AVAX) reached a new all-time high price of $64.90 on Sept 2 but has been moving downwards since.
AVAX is now attempting to find support at the previous daily close high near $54.40.
AVAX reaches new all-time high
On Aug 16, Avalanche broke out from a long-term descending resistance line and proceeded to reach a high of $58.98 on Aug 24.
After this, it began to move downwards inside a descending wedge, which is often considered a bullish pattern.
AVAX broke out on Sept 10 and proceeded to reach a new all-time high of $64.90 two days later.
However, it has been moving downwards since. The drop was preceded by bearish divergences in both the RSI and MACD (blue lines).
The main support is found at $39. This is both a horizontal support area and a level that coincides with the Supertrend support line (green).
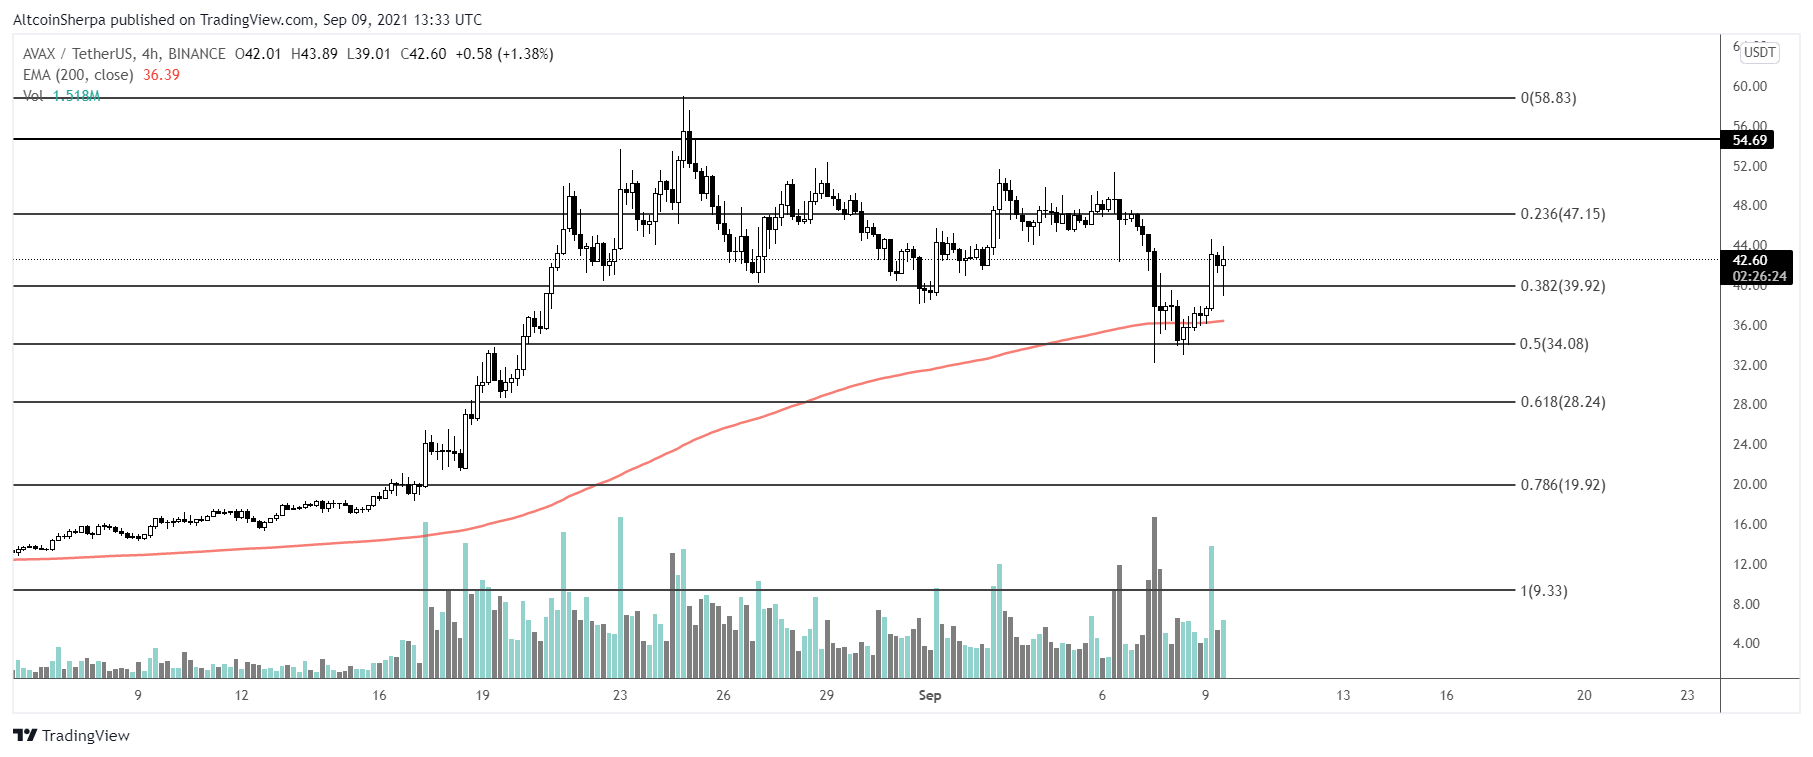
Cryptocurrency trader @Altcoinsherpa outlined an Avalanche chart, stating that it may continue to move upward as long as it’s closing above the 200-day moving average (MA).
Future movement
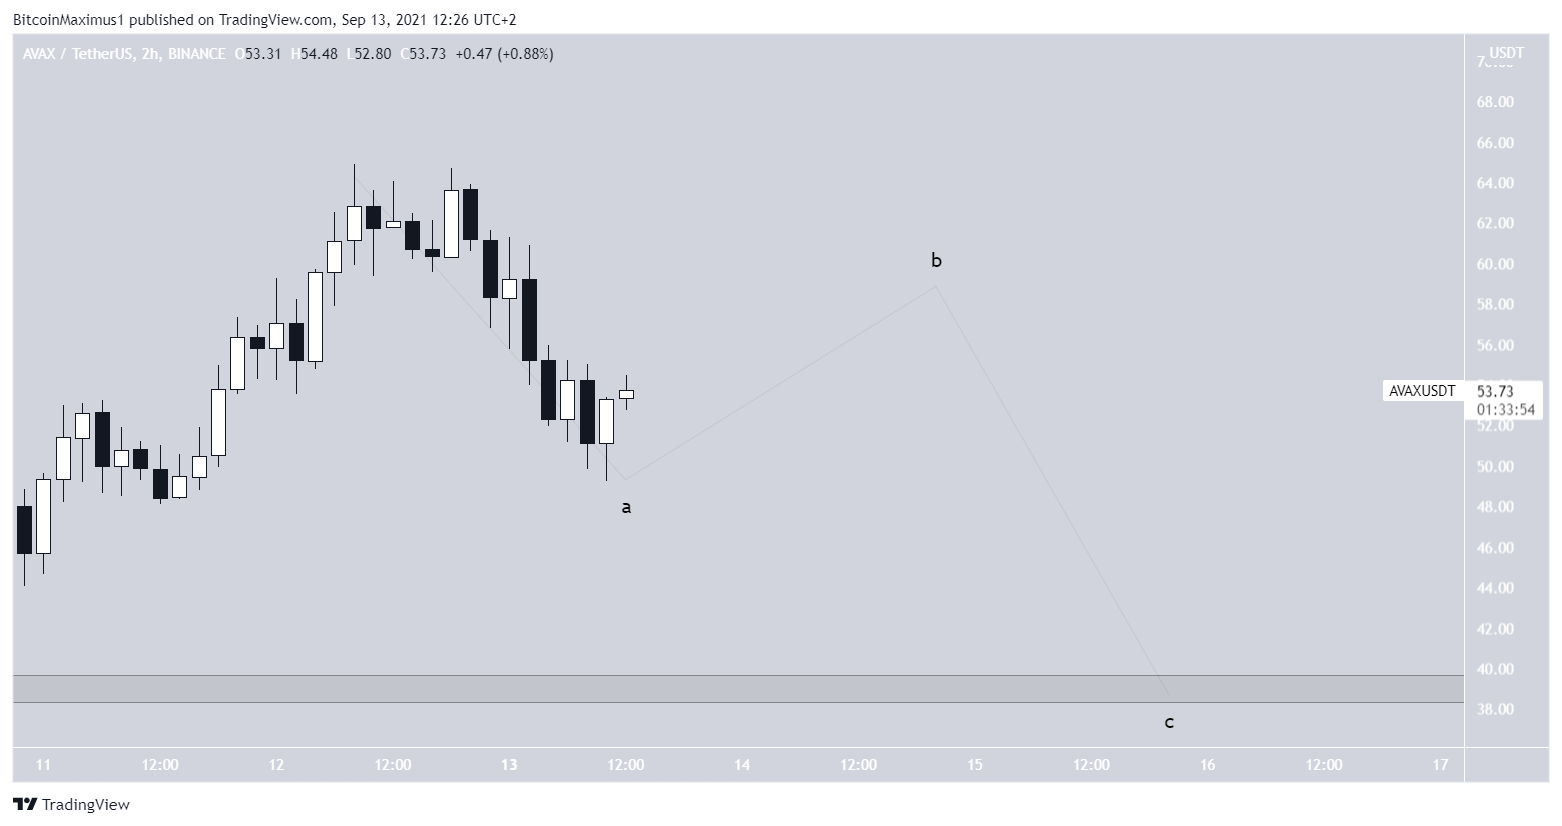
The two-hour chart shows that the $39 support area also coincides with the 0.786 Fib retracement support level of the most recent upward move. Therefore, if AVAX drops back, this level is likely to provide strong support.
The MACD and RSI have both turned bearish, so it’s possible that the current bounce is corrective and the low is not yet in.
In this case, AVAX may increase toward the $56 area and validate it as resistance prior to dropping to the $39 support.
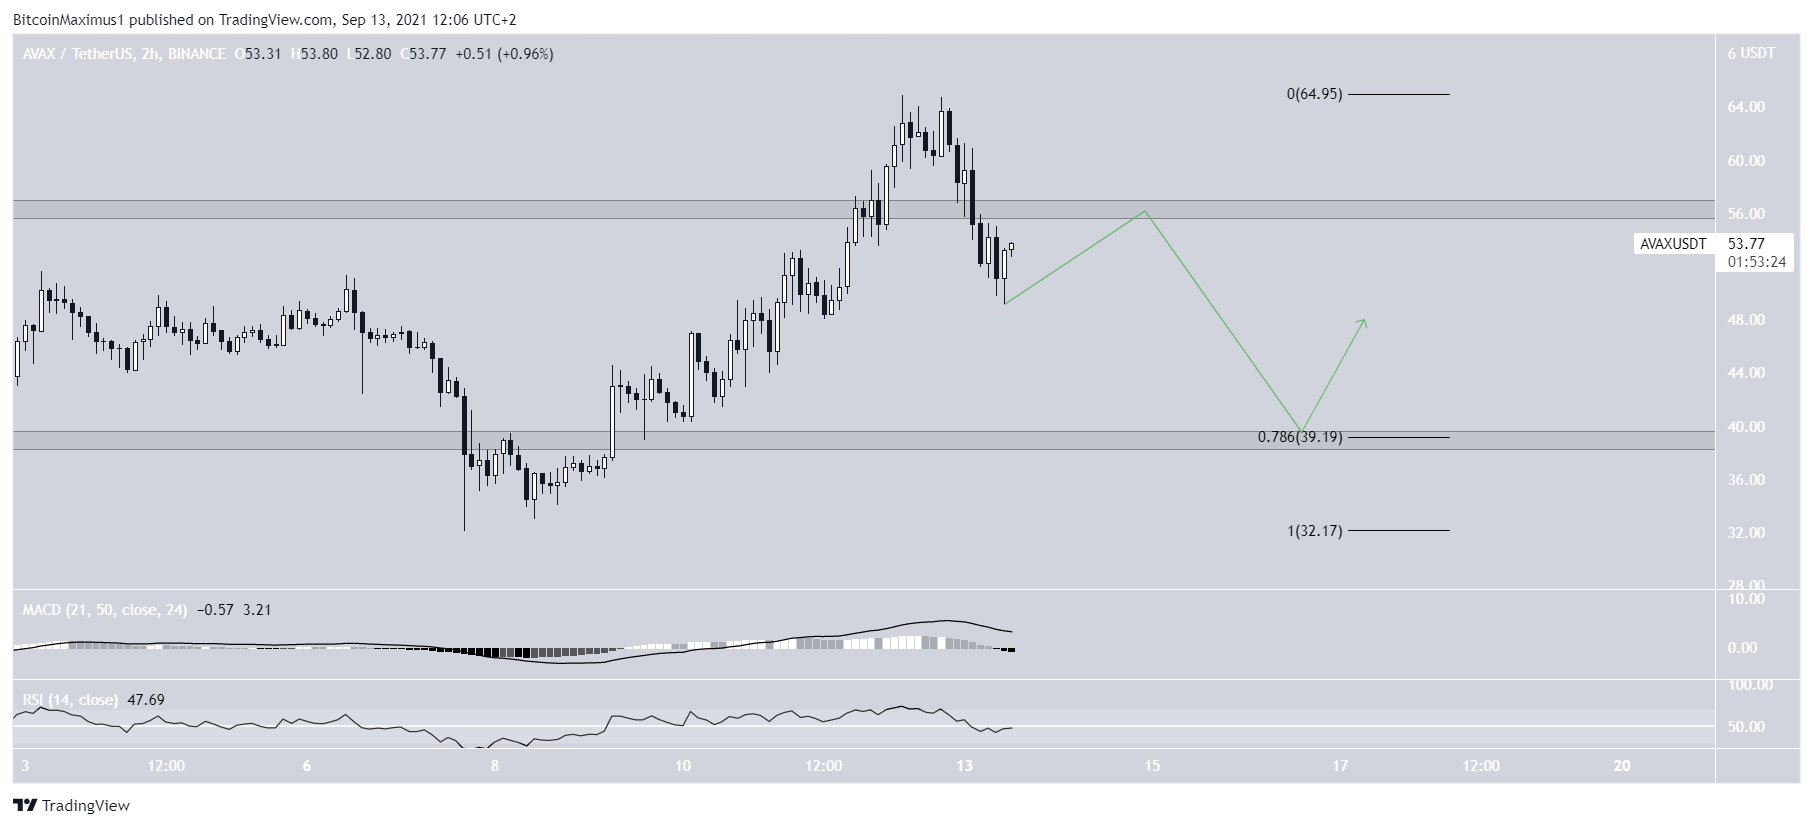
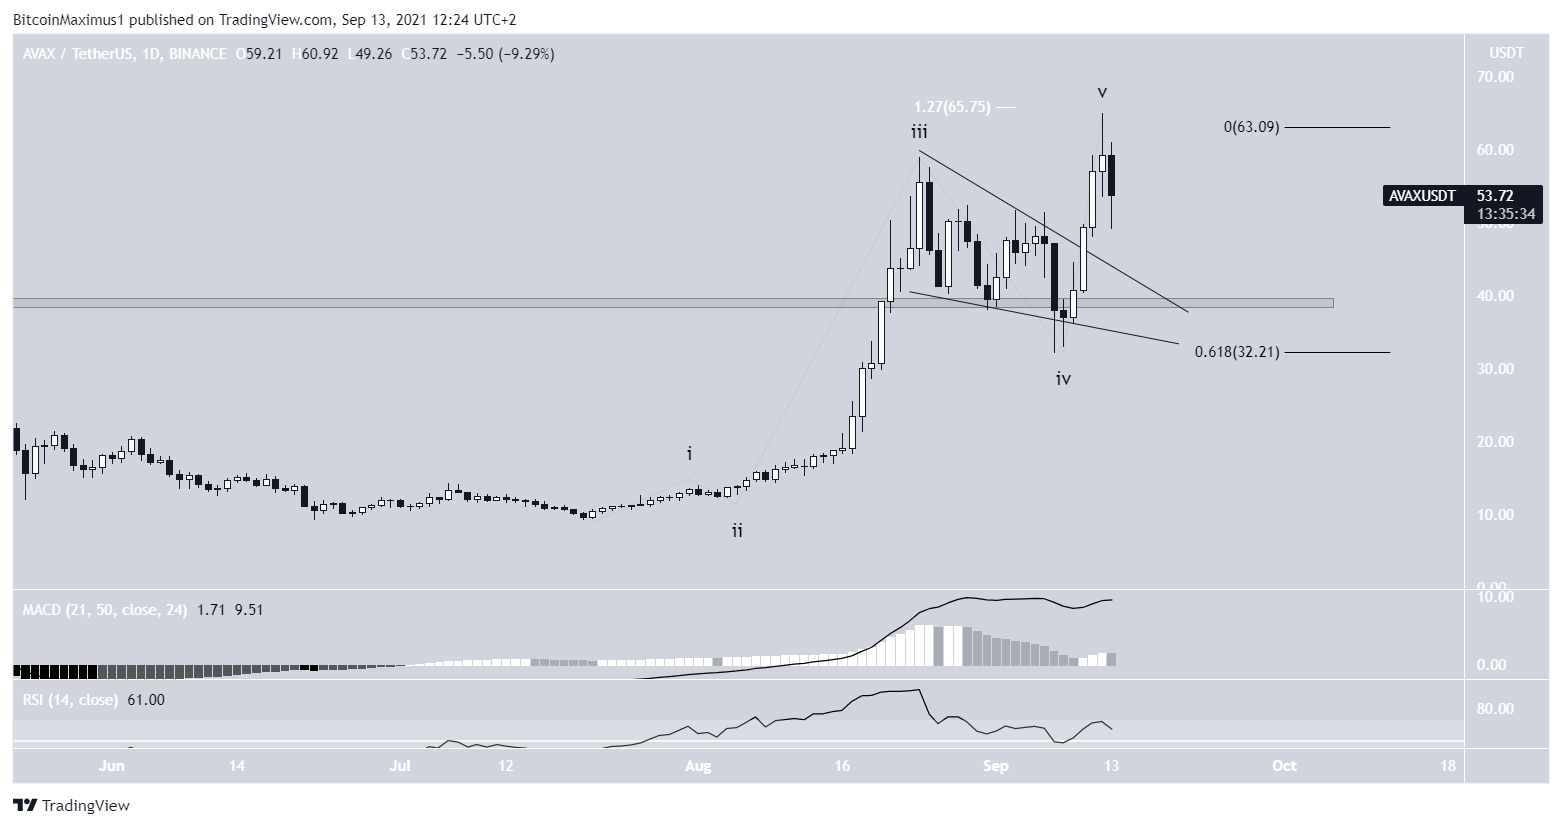
Wave count
The ongoing upward move appears to be a five-wave bullish impulse. In this case, the breakout from the descending wedge was part of wave four.
The high was reached at a confluence of Fib resistance levels, created by the 1.27 external retracement of wave four (white) and the 0.618 projection of wave 1-3 (black).
It’s not yet certain if the upward move is a long-term wave five or just sub-wave one of wave five. The former would mean that a high has been reached while the latter could eventually take AVAX towards a new all-time high and into a price discovery phase.
Whether the short-term decrease outlined in the previous section is an A-B-C corrective structure or a bullish impulse will likely determine if AVAX will move to new highs.
In both cases, a short-term decrease is expected.