HT is a native currency of Huobi Crypto Exchange, it was launched to offer discounts to customers. The token can be used to purchase monthly VIP status plans and get a discount on fees. VIP status holders have a voting right on exchange decisions and get seasonal cashback in the form of cryptocurrencies. Let us look at the technical analysis of HT.
Past Performance
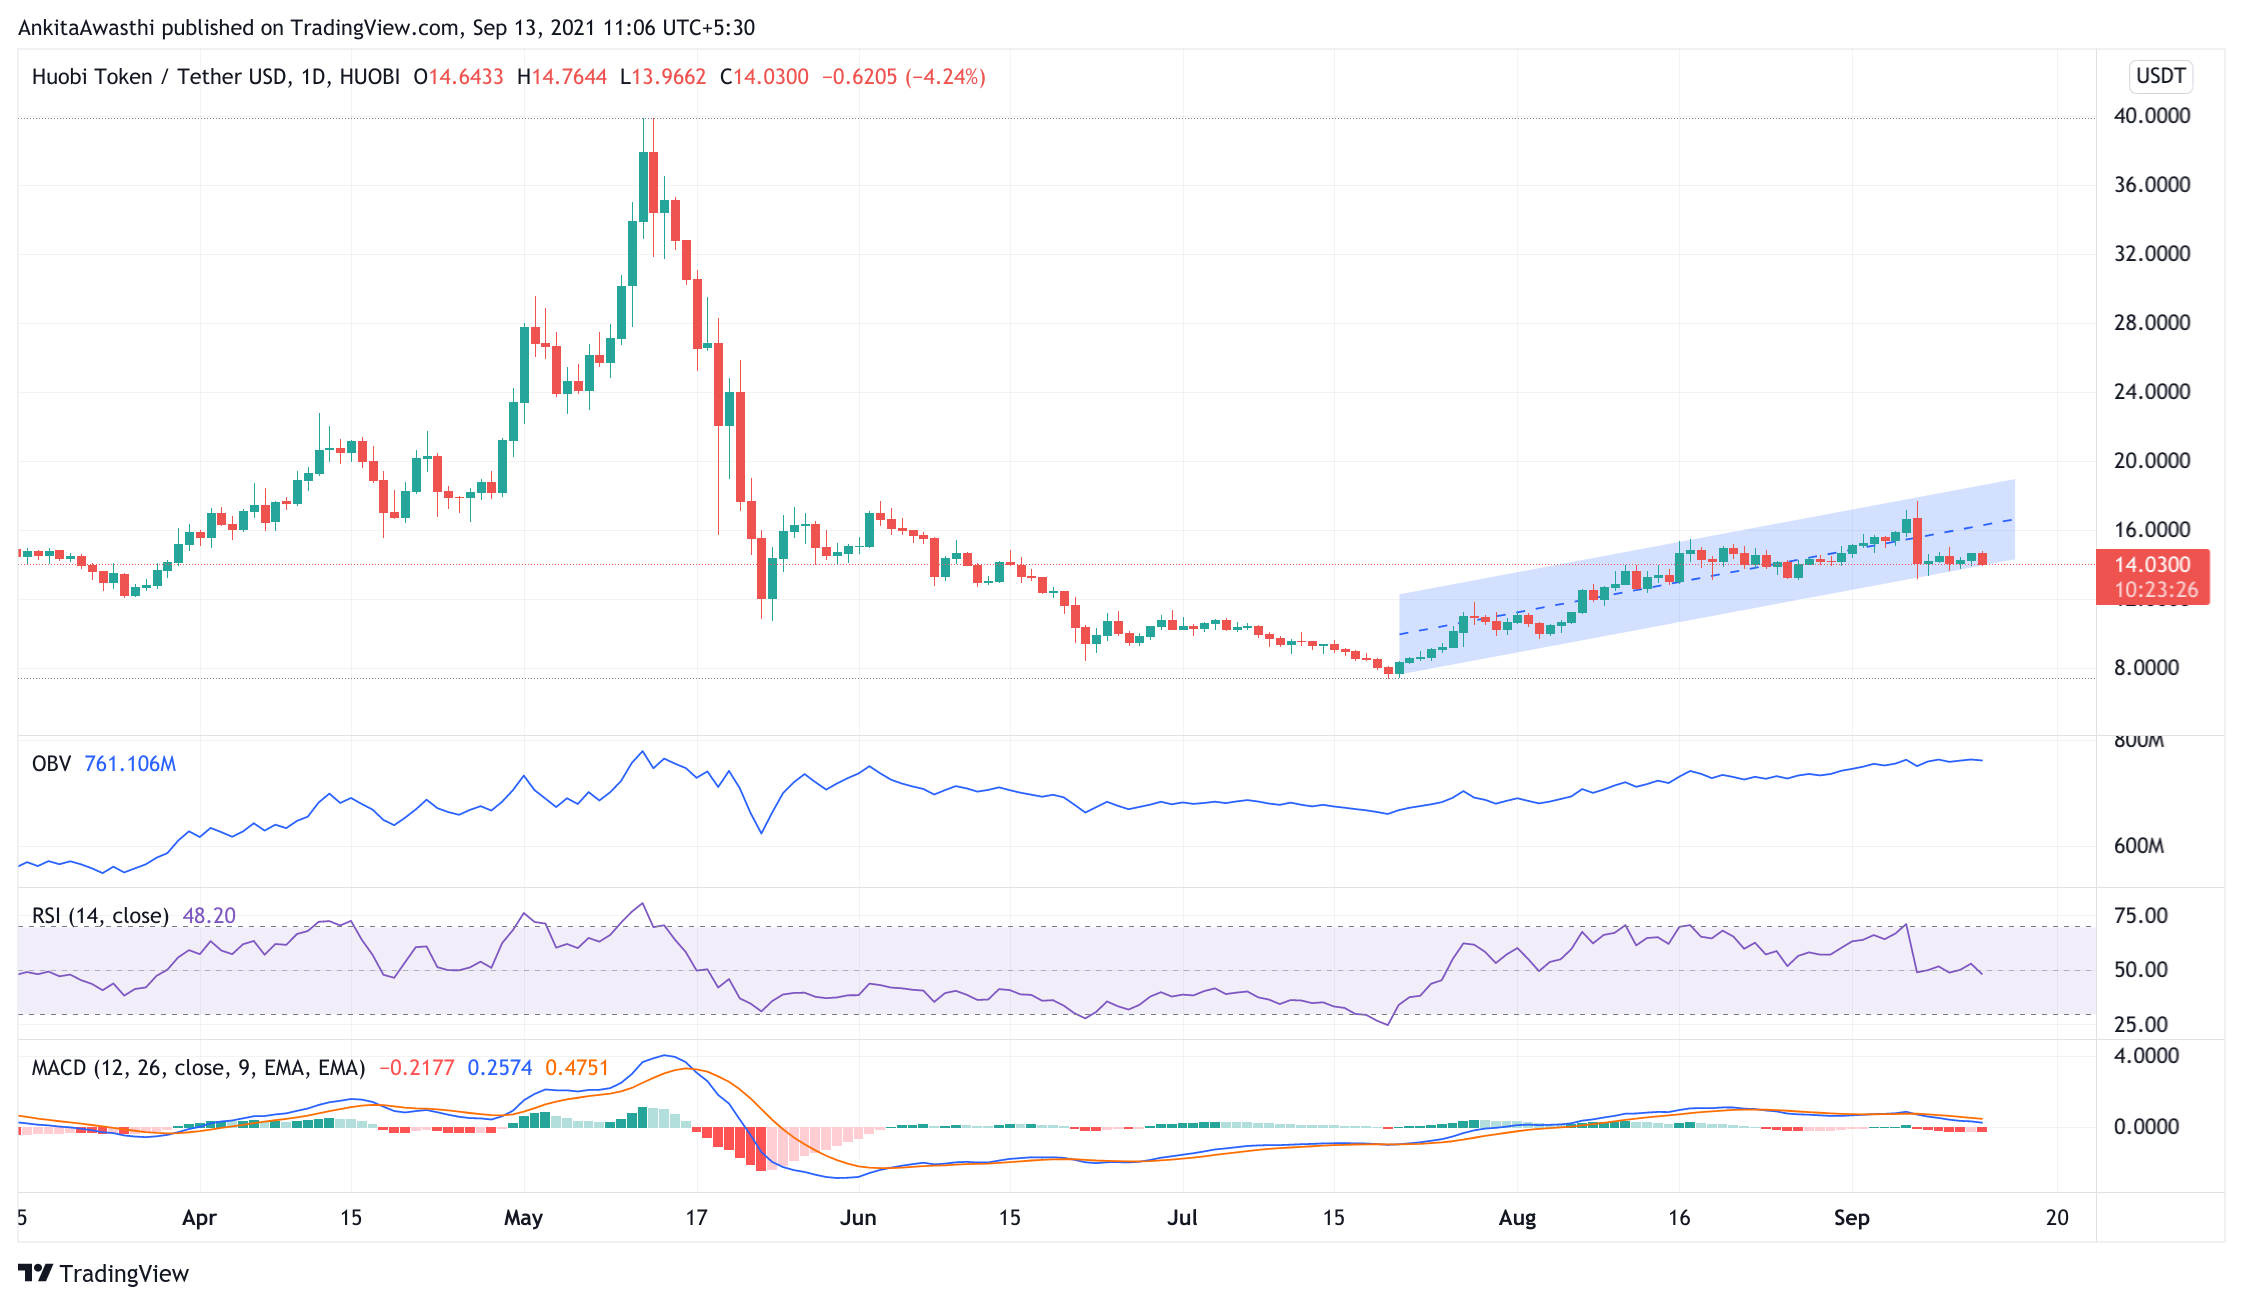
On September 06, 2021, HT opened at $16.29. On September 12, 2021, HT closed at $14.66. Thus, in the past week, the HT price has decreased by approximately 10.16%. In the last 24 hours, HT has traded between $14.23-$14.76. The current symbolizes that the HT market has not been volatile.
https://www.tradingview.com/x/ZR4zwx5l/
HT Technical Analysis
In a parallel channel, price takes support from the lower trend line. It pushes the price up from the lower channel. Currently, the HT price is near its lower trend line. Therefore, we can expect the price to bounce up after forming its support and base. If it breaks down from this level, it will confirm the bearish trend.
Currently, HT is trading at $14.19. The price has decreased from the day’s opening price. Thus, the market seems bearish.
The MACD and signal lines are in the positive zone. However, a bearish crossover by the MACD line over the signal line has occurred. Thus, the overall market momentum is bearish. Hence, the price may decline further.
Currently, the RSI indicator is near equilibrium level, breaking all its support and forming bearish divergence. We have to wait and watch if buying pressures become strong enough to bring about a trend reversal.
When we look at both the oscillators, we can say that the price may continue to fall. However, we cannot rule out the possibility of a trend reversal. We have to wait and watch to see if an intermittent price rise is a corrective action or the beginning of a positive trend.
Day-Ahead and Tomorrow
Currently, the HT price is below the second Fibonacci pivot point of $15.53. The $17.58 level is a long-term resistance level. If the bulls remain strong till day end, then the price is likely to rise above and highlight the first, second, and third resistance levels of $21.71, $25.20, and $28.68, respectively.
However, if the bears remain strong, then the price will likely break down from its current level. The price will then try to find support near $13.22. A breakdown from this level will highlight the next support level at $12.45. Traders can take a short position accordingly from this level.