
DCR prevents blockchain technology and prevents monopoly in the decentralized structure. Decred Protocol makes sure that DCR token holders have equal voting rights and have the same decision-making power. The following DCR technical analysis will predict the price trends for the next two days:
Past Performance
On September 02, 2021, DCR opened at $182.60. On September 08, 2021, DCR closed at $145.56. Thus, in the past week, the DCR price has decreased by approximately 20%. In the last 24 hours, DCR has traded between $136.46-$151.45.
https://www.tradingview.com/x/7FOZxcJs/
DCR Technical Analysis
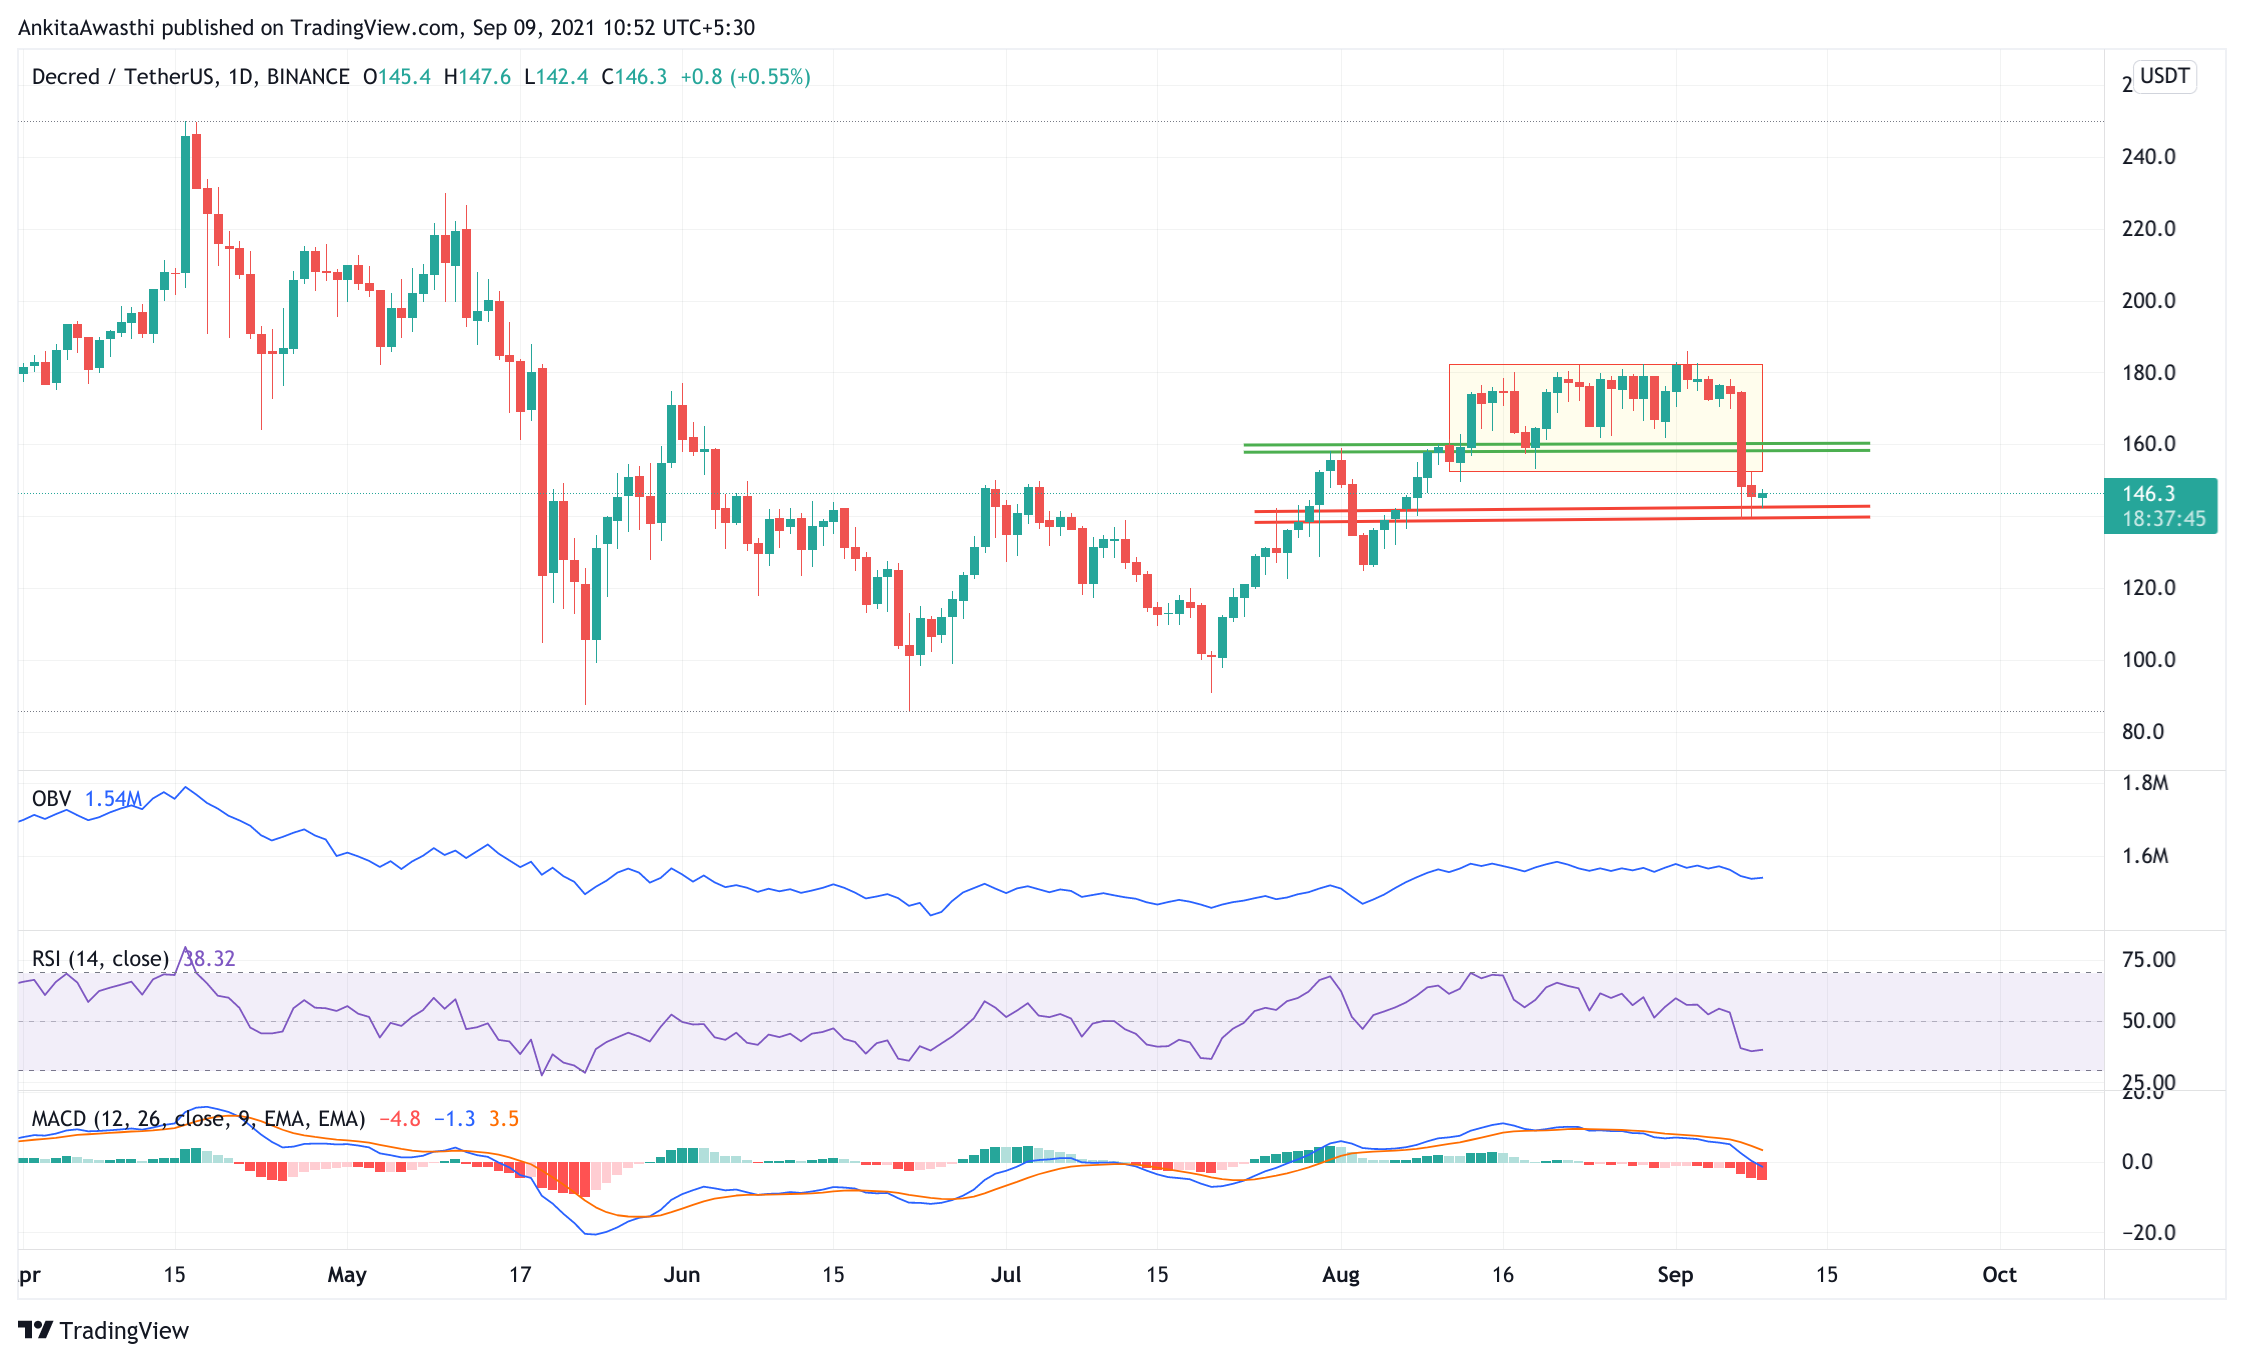
DCR has been trading in a range for the past few days. A shakedown in the price of BTC led to a 15% breakdown in DCR’s price as well. With this breakdown, the price collapsed down from its range and has formed a new support zone. We will have to wait and see if it bounces back after taking support from this zone.
However, the long-term trend of the coin is intact. This could be another healthy correction in the bull run. Let us look at the price action of the coin:
Currently, DCR is trading at $145.99. The price is approximately 3.15% down from the day’s opening price. Thus, it seems like bears have taken control of the market. Moreover, the $142 level has acted as strong support. Any breakdown from this level will confirm the bear trend.
On the daily chart, the MACD and signal lines are in the positive zone. However, a bearish crossover by the MACD line over the signal line has occurred. Thus, the overall market momentum looks bearish. Hence, the price may decline further for the rest of the day.
Currently, the RSI indicator has broken its support level and currently is at 39%. It faced rejection at 50.84% and has fallen straight to this level. Thus, it indicates that the selling pressure is high in the market. Moreover, the RSI is forming a bearish divergence. We have to wait and watch if buying pressures become strong enough to bring about a bearish trend reversal.
The OBV indicator has started moving in a downward trajectory. Indicating that the investors are losing interest in the coin.
Day-Ahead and Tomorrow
The DCR is trading below the second Fibonacci pivot point of $152.58. If the bears remain strong till day end, then the price is likely to fall below the first, second, and third support levels of $142, $141.66, and $124.86, respectively.
However, if the buyers take over the market, then the first resistance level price has to break is $157.30. Once this pivot level of $157.30 is broken, the price will highlight the next FIB resistance level of $170.85. Subsequently, traders can take a long position accordingly.