The technical analysis reflects the declining trend under the influence of resistance and 200-day EMA with RSI struggling to stay above the halfway line. VeChain (VET) price action displays a downtrend in the market as prices dropped below $0.018 during early trading hours. Although recent consolidation signals some stability in the market, the sideways movement is yet to confirm a recovery pattern. Despite the 24-hour trading volume of VET rising by 20.05% to $34.04 billion, the VET saw a drop of 4.11%. Indicating a downtrend, the market valuation also declined to $1.31 billion with a 4.05% drop. At a base level of $0.017, the descending triangle pattern formed by trendlines confirms the bearish momentum in the market.
Key Points
- The VET price action shows a drop of 4.11% in the market
- The descending triangle pattern on the daily chart indicates a bearish trend
- With a rise of 20.05%, the intraday trading volume in VET stands at $34.04 billion
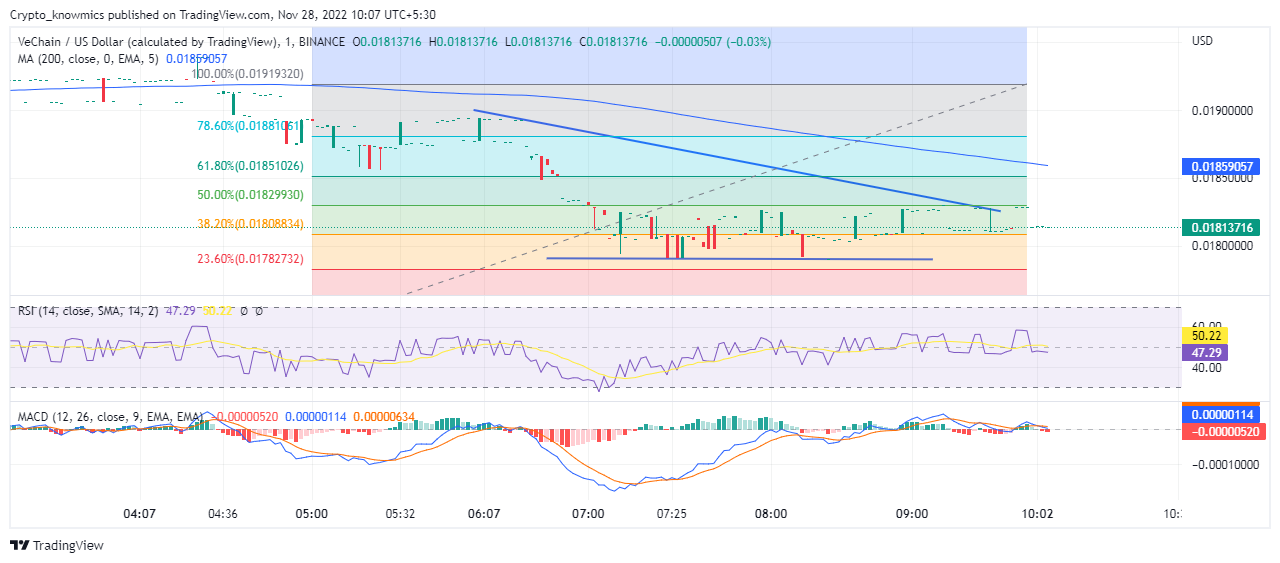 Source: Tradingview
VET Technical Analysis
VET has delivered sluggish growth in the last few weeks as the token has plunged 22.3% over the last 30 days. Today’s price action also reflects a bearish momentum as a sideways downtrend is yet to witness a breakout. The VET prices dived down sharply from 78.60% on the Fibonacci retracement level to 38.20%, also supporting the bearish trend in the market. If VET continues to consolidate, it may break above the crucial mark of $0.020. On the other hand, if the token could not recover after consolidation, it may break below $0.018. The sideline traders may expect entry and exit opportunities if the token witnesses a breakout on either side.
Technical Indicators
Although RSI struggles to stay above the mark of 50, the slope displays balance in the demand and supply to some extent, while giving a bearish divergence. Additionally, the fast and slow lines also reflect a slightly bearish trend as MACD teases a bearish crossover. Hence the technical indicators show there is a lack of bull in the market, however, traders may find entry and exit opportunities after the present consolidation phase.