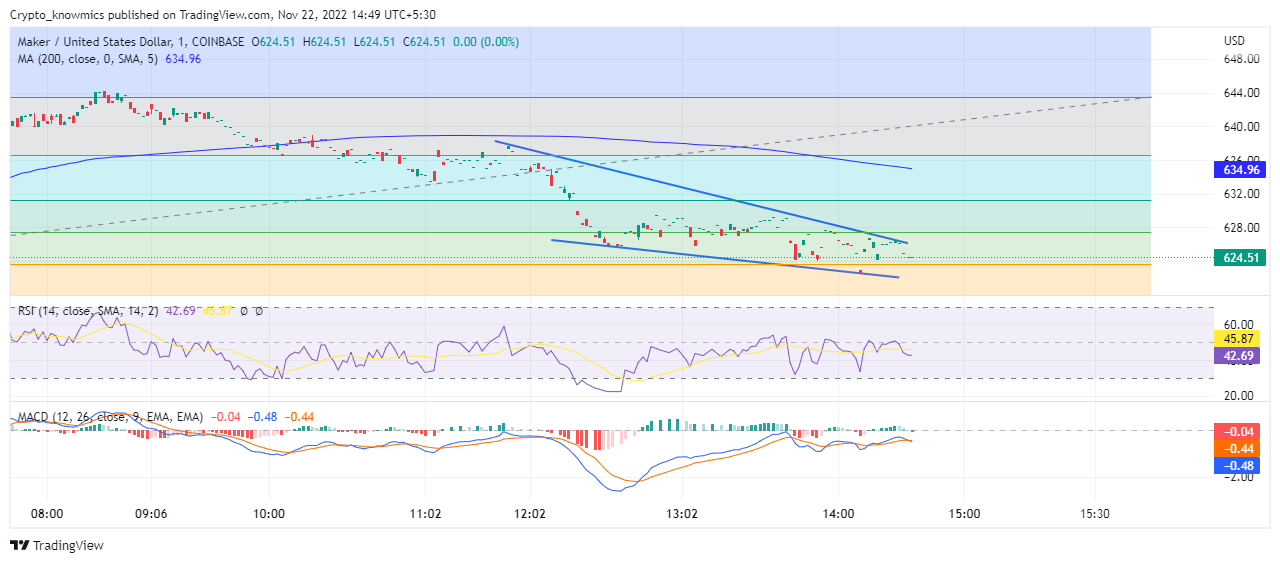
The MRK technical analysis displays Maker prices sharply moving far below the 200-day SMA with RSI struggling to break above 50 and MACD set for another downswing. Maker (MKR), the governance token of MakerDAO and Maker Protocol, currently trading for $622.32, demonstrating a minor price drop of 1.09% in the last 24 hours, while the trading volumes have dropped by 9.82% during the same period, reflecting lack of enthusiasm among traders. As MKR is perpetually declining since the market collapse in early November from $900 to break below the crucial support of $700, the last 14 days accounted for a drop of 24.4%. Since then MKR has been consolidating above $600, but still, prices struggled to stay above $650. The market cap also slightly declined by 0.90% to $649.61 million, supporting a downtrend in the market with a daily low of $613.78.
Key Points
- MKR price actions display a lack of bull as prices brace for new low
- The daily chart shows a continuation of the downtrend with multiple high-price rejection candles
- The intraday trading volume in MKR is $19.41, reflecting a drop of 9.82%
 Source: Tradingview
MKR Technical Analysis
With multiple lower lows and lower highs, the MKR price actions reflect a strong downward trend with prices continuing to see new lows. MKR prices persistently moving below the 200-day also support the increasing bearish momentum in the market, coupled with several high-price rejection candles moving along the resistant trendline. The sideline traders must wait for a breakout on either side to make an entry and exit. If MKR manages to reverse the trend, it may break above $700 which it has failed to reach in the last two weeks. Whereas if bearish momentum continues to pull back the MKR, dropping below $600 support could not be thwarted.
Technical Indicators
Due to increasing selling pressure, the RSI struggled to move above the midpoint, making multiple bearish divergences around the 45 mark while falling below the 14-day SMA, reflecting high supply in the market due to bearish sentiment. Likewise, fast and slow lines cross each other to make a bearish crossover as bearish bars again appear on the histogram. Therefore the technical indicators show that MKR is explicitly on a declining trend with RSI moving below the 45 mark and MACD indicating another downswing.
 cryptoknowmics.com