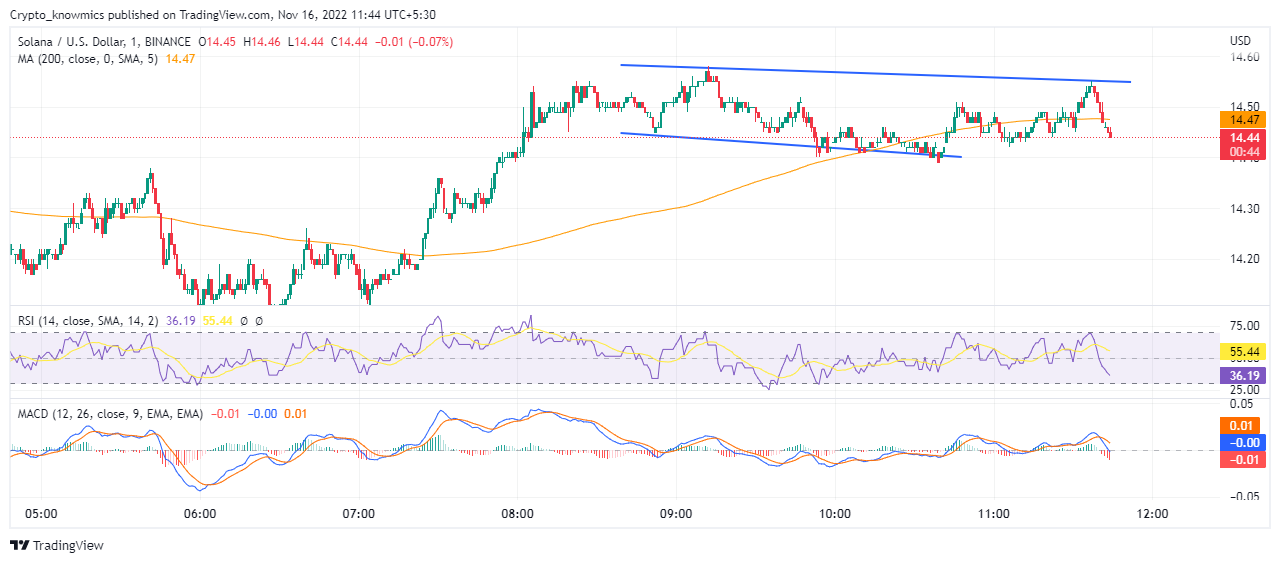
The SOL technical analysis shows the continuation of a bearish trend as prices consolidate below $15 after a minor initial recovery, with an RSI below 45. Hitting its one-year low of $12.43 earlier this week, Solana (SOL) is going through a prolonged bearish trend since early November. The downtrend gained strength owing to bearish sentiments in the market due to financial crises in FTX with the CEO resigning from the post. In the last 10 days, the SOL broke below the support zone of $30 and $25. Despite witnessing a 2.75% surge in prices over the past 24 hours, SOL remains below the psychologically important mark of $15, as buyers are seen as less enthusiastic.
Key Points
- RSI below 45% and MACD below signal line display bearish momentum
- SOL daily chart displays the possibility of a minor bullish reversal
- The intraday trading volume in SOL is $740.67 million.
 Source: Tradingview
SOL Technical Analysis
In our previous technical analysis, SOL price actions displayed a downtrend with increased selling pressure, sliding below the crucial mark of $30 to make support at $25. But since November 6, the SOL prices have been persistently on a bearish trend, crashing below the support zone of $30-$25. At the current trading price of $14.44, SOL makes support at $12.50. Due to a prolonged bearish trend in the market, the trading volume of SOL has fallen 42.26% in the last 24 hours to reach $740.67 million. However, at $5.25 billion, the SOL’s 24-hour market cap has seen a 2.84% rise. At present buyers' sentiments, it is very unlikely that SOL will break its $25 resistance level.
Technical Indicators
RSI dived down below 45% making a bearish divergence under the 14-day SMA, approaching an oversold boundary, signaling a bearish sentiment in the market. MACD line moves below the signal line making a bearish crossover under the halfway line as the histogram turns bearish. Therefore, despite the initial recovery, the technical indicators exhibit increasing selling pressure as SOL prices struggle to move above the 50% level, with the trendline witnessing multiple high-price rejections.
 cryptoknowmics.com