Bitcoin Cash may have seen a sharp price decline of 11% over the past 7 trading days, dragging the current price down to around $392, but the cryptocurrency is still up by 34% over the past 30 days with a further price explosion of 199% over the past 3 months.
Bitcoin Cash has been on a magnificent bullish run which has now allowed it to climb to the 4th place amongst the top cryptocurrencies by market cap value. Its total capitalization is currently $7.04 billion.
The cryptocurrency had managed to surge to a high above $480 during May 2019 but it has since fallen to where it currently trades at around $392.
Looking at the BCH/USD 1-Day Chart:
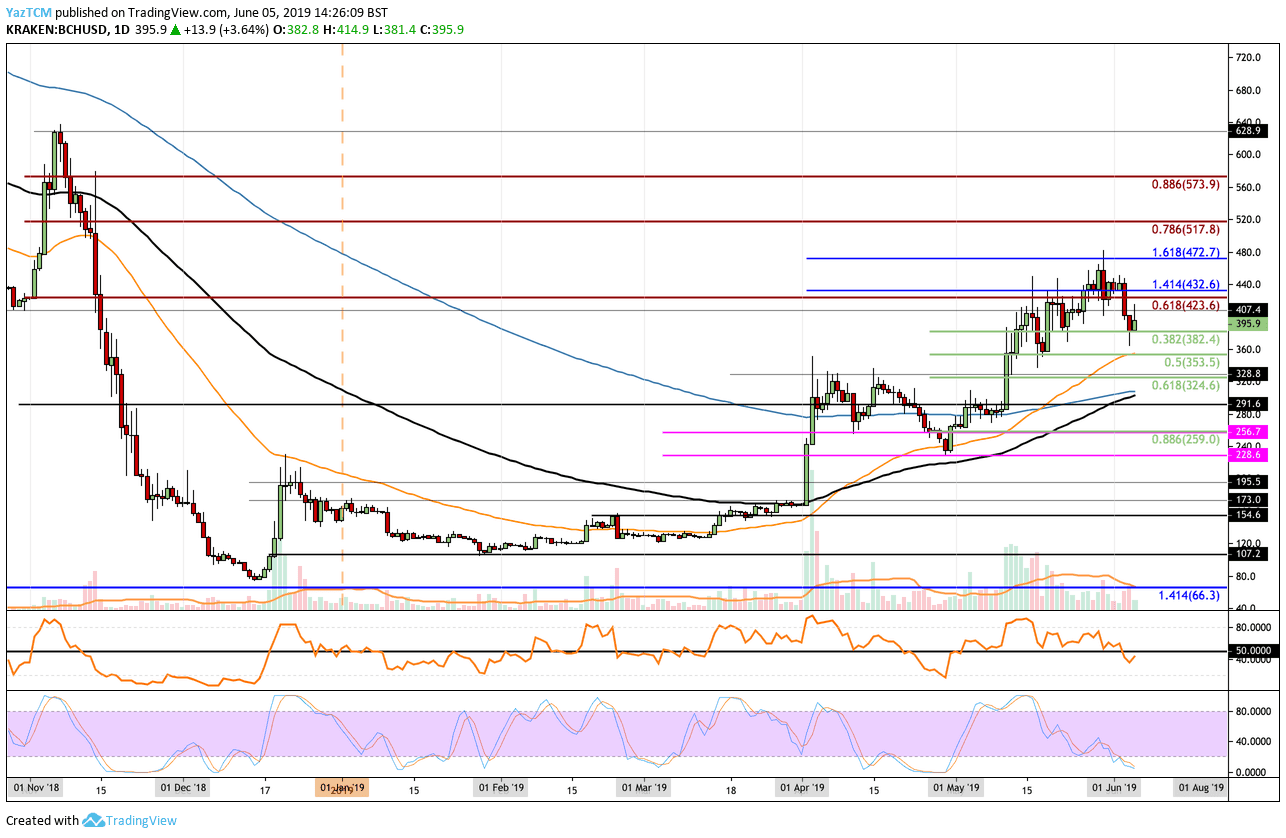
- Against the US Dollar, we can see that Bitcoin Cash has fallen from the May 2018 highs and is now currently trading at support around the $382 level, provided by a short term .382 Fibonacci Retracement level (marked in green).
- From above: The nearest level of resistance now lies between $420 and $423. The resistance at $423 is provided by a long term bearish .618 Fibonacci Retracement level (marked in red) measured from the November 2018 high to the December 2018 low.
- If buyers continue to climb above the resistance at $432 and $450, further resistance is then expected at $472 and $500. Above $500, higher resistance lies at $517 (bearish .786 Fib Retracement) and $573 (bearish .886 Fib Retracement). The final level of resistance to highlight the above lies at the November 2018 high at around $628.
- From below: The nearest level of support now lies at $382. Beneath this, further support can be found at $353 which is strengthened by the 50 days EMA and short term .5 Fibonacci Retracement. Beneath $350, further support lies at $324, $300 and $293 (which contains the 100 days EMA and 200 days EMA).
- The trading volume has been decreasing aggressively during mid-May 2019 but has started to show some signs of increasing in June 2019.
- The RSI has recently slipped beneath the 50 level which indicates that the sellers are in control of the market momentum. However, the Stochastic RSI is currently trading in extreme oversold conditions which suggests that this current period of selling should not last much longer as we look for a crossover above to send a bullish signal to traders.