Ripple has seen a steep price fall over the past 7 trading days which totals around -10.53. The recent price fall, largely caused by the recent Bitcoin drop plummeting beneath $8,000, has now caused Ripple to fall beneath the $0.40 level to where it is currently trading around the $0.3987 level.
Despite the recent price falls, Ripple has managed to increase by a total of 30% over the past 30 trading days. The recent price increase has also helped Ripple to climb above the previous stagnant trading range that it had been trading within.
Ripple is now ranked in the 3rd position in the market cap rankings as it currently holds a $16.85 billion market cap valuation. Let us take a look at the Ripple market and highlight some potential areas of support and resistance moving forward.
Ripple Price Analysis
XRP/USD – MEDIUM TERM – DAILY CHART
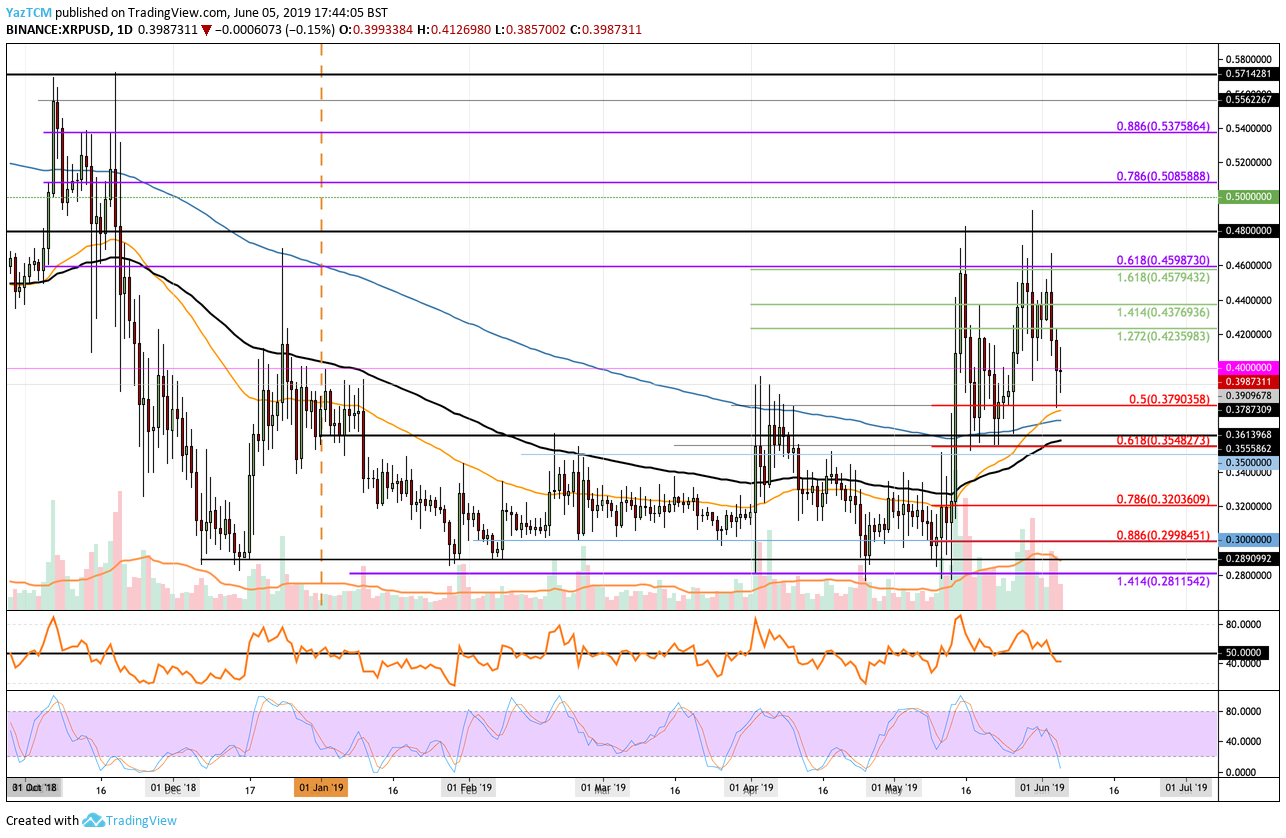
Analysing the daily chart above, we can see that during May 2019, ripple had managed to break above the $0.30 level to climb much further higher into resistance at the $0.46 level. The resistance at this level is provided by a bearish .618 FIbonacci Retracement level (drawn in purple) measured from the November 2018 high to the December 2018 low. The break above the $0.40 level had allowed Ripple to exit the stagnant trading period that it had been trading within since January 2019.
As June started to trade, we can see that Ripple has since fallen from this resistance but has managed to rebound at the support around the $0.3790 level, provided by a short term .5 Fibonacci Retracement level (drawn in red).
We can also see that during May 2019, there was a Golden Crossover signal – when the 50 day EMA crossed up above the 200 day EMA to deliver a very long term bullish signal.
Looking ahead, if the buyers regroup and start to push the market above the $0.40 level again, we can expect immediate resistance above the market to be located at the $0.4235 and $0.4376 levels. Above this, the next level of resistance is expected at the bearish .618 Fibonacci Retracement level (drawn in purple) priced at $0.4598.
IF the bulls can continue to climb above $0.46, further higher resistance above is then located at $0.48 and $0.50.
Alternatively, if the sellers continue to pressure the market lower, we can expect support toward the downside to be located at $0.39, $0.3790 and then at the short term .618 Fibonacci Retracement level (drawn in red) priced at $0.3548.
The RSI has recently dipped beneath the 50 level to indicate that the sellers have taken control of the momentum. If we would like to see recovery, we would need to see the RSI climb back above the 50 level.