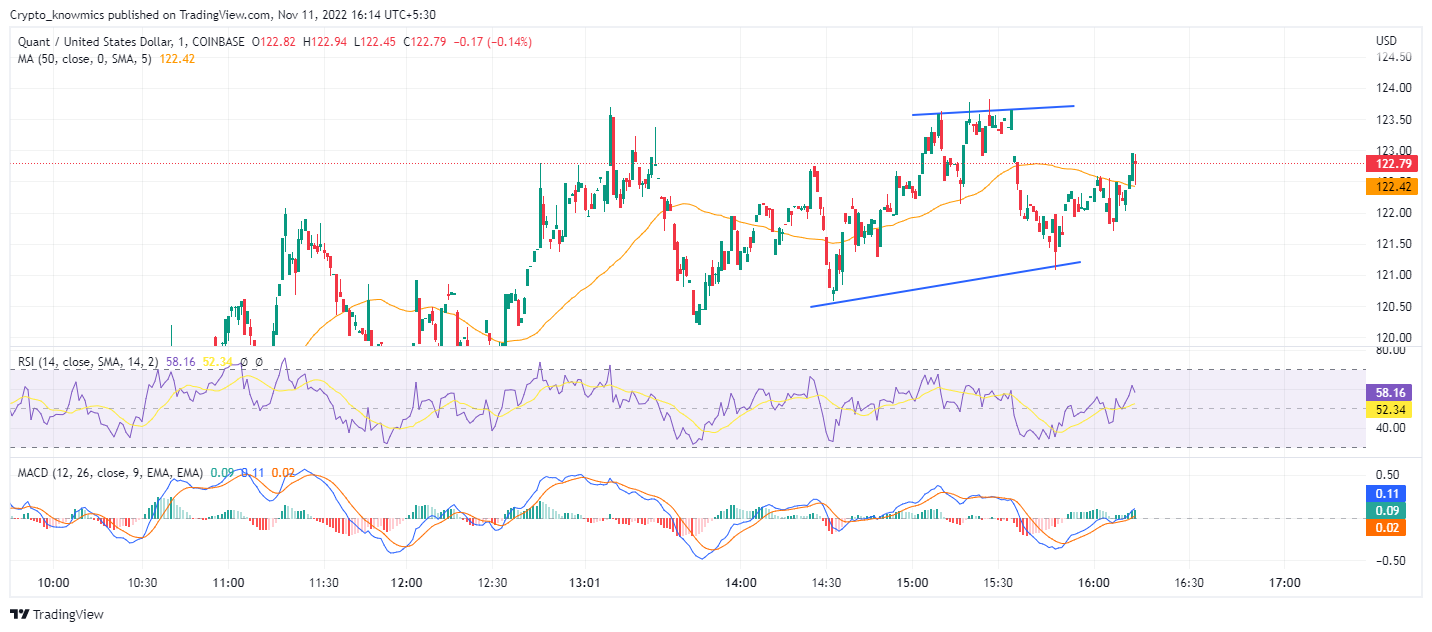
The technical analysis of QNT indicates a bullish struggle as the price is unable to break the glass ceiling of $155, while RSI indicates a buying opportunity. Despite falling 23.14% in the past 7 days due to the recent market crash, Quant (QNT) has made a sharp rebound with a 7.45% jump in the last 24 hours. Trading at $122.37 at the time of writing, QNT touched the daily high of $135.51, before rebounding from the daily low of $108.28, closely escaping the mark of $100. The market cap increased by 6.74% to $1,477,768,259, projecting a high possibility of a bearish reversal as the uptrend gains momentum. However, the price struggled to break the $155 resistance during selling pressure which may be surpassed this week if demand continues to grow.
Key Points
- QNT price actions show an uptrend with multiple lower price rejections
- The daily chart shows the price moving above the 50-day SMAindicating a bull cycle
- The intraday trading volume in QNT is $165.24 million.
 Source Tradingview
QNT Technical Analysis
After a dramatic collapse in the crypto market, the QNT reclaimed the bullish momentum in the last 48 hours before escaping to drop below the psychologically important mark of $100. The QNT price action maintains a bullish trend with multiple lower price rejections in the daily chart. The traders can find buying breakout entry opportunities if the trend continues. If QNT sustains the selling pressure, it may break the ceiling of $155 to unleash a bullish rally. But if the buying trend loses strength, the price may be dumped around $100.
Technical Indicators
RSI slope moves along the 60% line teasing a bearish divergence signaling and buying opportunity. As the histogram strengthened the bullish trend, the gap between MACD and signal lines increased while they moved above the halfway line to confirm the upward trend. Therefore, QNT’s technical indicators reflect a clear uptrend indicating entry opportunity for traders at every breakout as demand continues to grow.
 cryptoknowmics.com