The technical indicators display a strong bearish trend in CAKE as price actions fallout below major support of $4.0012, with RSI moving along the supply zone due to rising selling pressure. As fear of FTX collapse crashed the entire crypto market, CAKE is not the exception which dropped 13.71% in the past 7 days hitting its two-month low. Currently trading at $4.02 at the time of writing, the CAKE price has dropped more than 6.89% over the last 24 hours touching a 24-hour low of $4.35, down by $ 0.3331548. CAKE price actions show a bearish trend as the downtrend breaks the crucial support level of $4.0012, approaching the bottom support at $3.9611.
Key Points
- The CAKE price action shows a bearish breakout entry opportunity
- The price dump crosses below the $4.0012 support level
- The intraday trading volume of PancakeSwap is $114.4 million
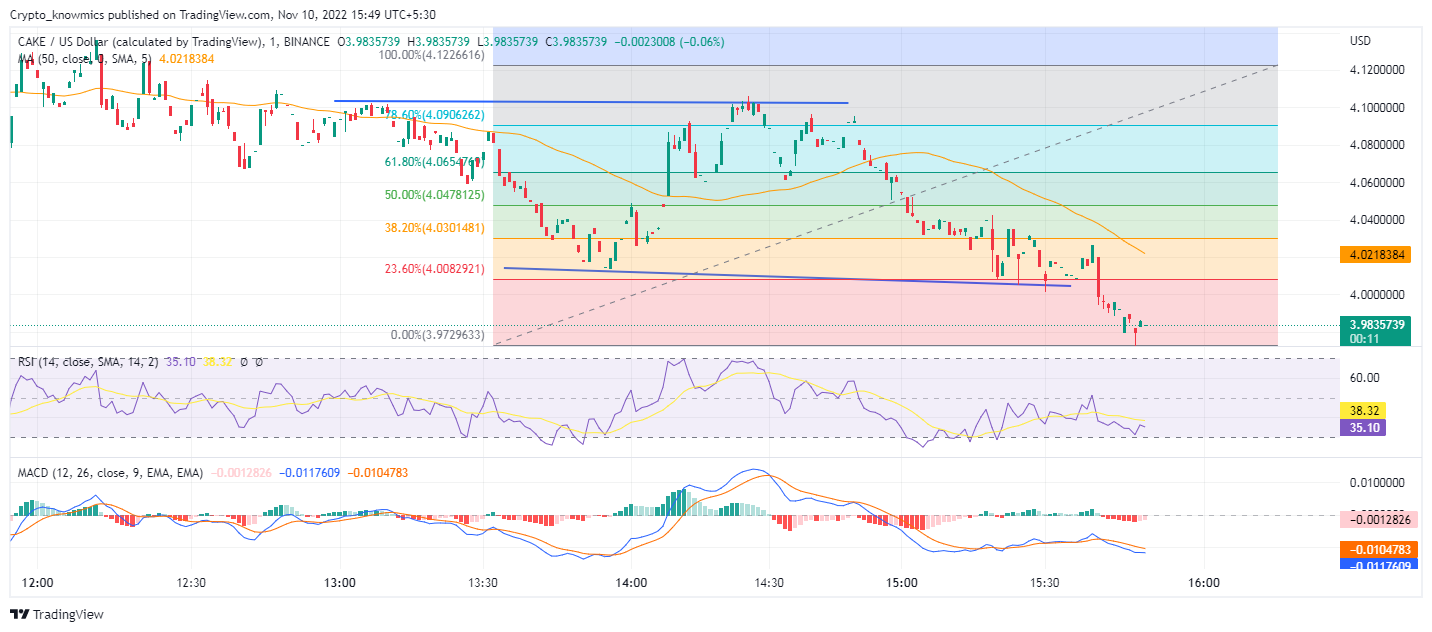 Source Tradingview
CAKE Technical Analysis
The downtrend gains momentum as the price action dives below the 23.6% Fibonacci retracement level. CAKE price actions show the growing influence of a bearish trend across the consolidation range resulting in a downtrend. As the prices have fallen below the crucial support level with multiple low-price rejections, the market is characterized by a selling spree. Moreover, the rising trading volume confirms the bearish breakout and indicates the continuation of the downtrend. If the selling pressure increases over the day, the CAKE prices may drop below the broken tradeline, where sideline traders can take a bearish position.
Technical Indicators
Making steep bearish divergence, the RSI slope kisses the oversold boundary below the 14-day SMA signaling buying opportunity with every reversal rally. MACD drops sharply after making a bearish crossover moving below the signal line far below the halfway line showing high selling pressure. The histogram also shows a bearish trend in price action. The technical indicator displays a continuation of the bearish trend with repeated low-price rejections and high selling pressure as the RSI and MACD indicator highlights.