The technical analysis highlights a strong downtrend in BNB, with RSI hovering around the oversold zone, making multiple bearish divergences. Binance Coin (BNB) was the biggest gainer last week after Elon Musk finalized its Twitter acquisition deal in which Binance is an investor. Binance also committed to helping Musk to curb the menace of fake and bot Twitter accounts. This crypto rally led BNB to cross the mark of $350, after May. Moreover, As soon as the news of Binance acquiring FTX broke early this week, the token rallied 25% within an hour, but could not sustain the uptrend longer. Although most of the crypto market crashed in the last 2 days, Binance Coin (BNB) remained in the green zone despite nominal growth. However, BNB could not spare itself from the current downtrend in the market due to a faceoff between crypto exchange Binance and FTX, as it plunged over 3% in the last 24 hours.
Key Points
- BNB price actions displayed a downtrend with increased selling pressure
- BNB entered a downtrend with multiple low-price rejections
- The intraday trading volume in Binance Coin is $5.12 billion
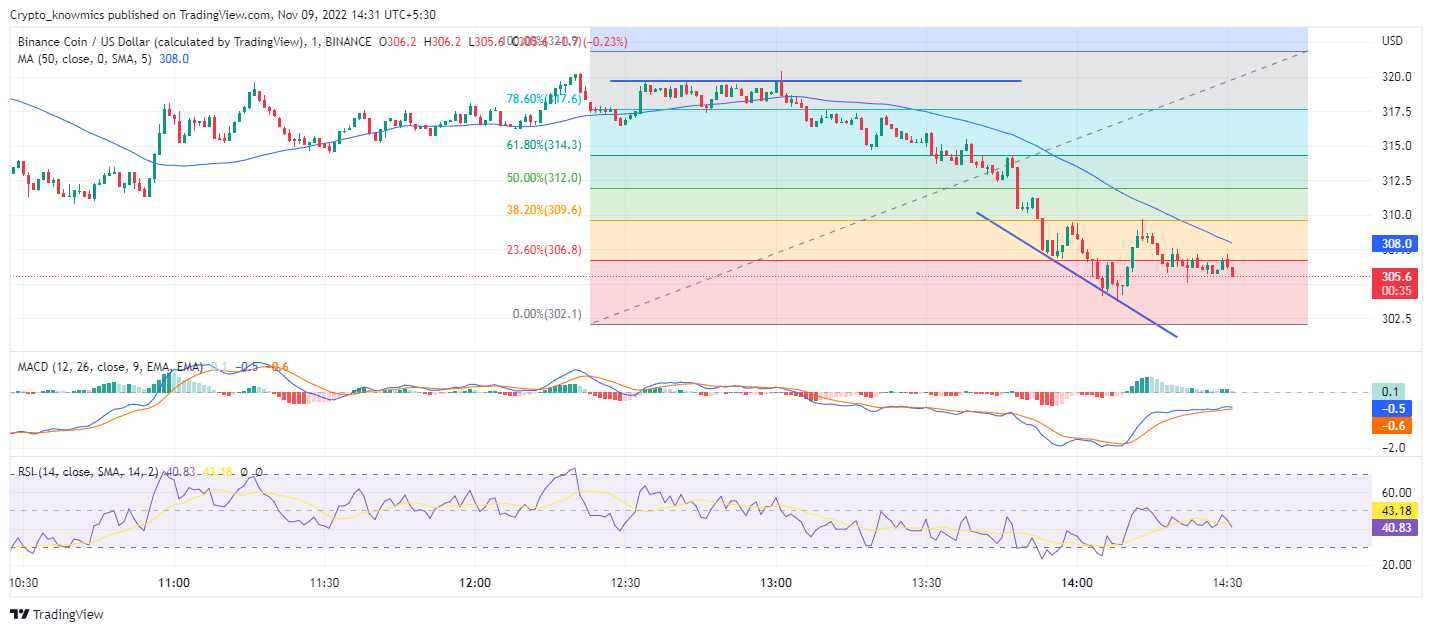 Source Tradingview
BNB Technical Analysis
Currently trading at a price of $316, BNB declined $8.13 today during intraday trading. Despite last week’s bull cycle, the BNB’s 7-day price displays a 1.29% drop in price. The BNB price line moving below the 50-day SMA signal a continuous decline in the market as BNB does not show any sign of recovery, extending the wait for buyers. So far, the BNB price trend does not seem to be sustaining the selling pressure as the price channel broke the previous support level. The price action does not show any significant consolidation even below 23.6% Fibonacci retracement.
Technical Indicators
After moving sideways near the oversold zone for a long time, RSI slopes struggle to cross the halfway line making multiple bearish divergences, confirming the downtrend. After a slight recovery, MACD teases the bearish crossover as the bearish histogram begins to decline, reflecting weakness in the bullish momentum. The technical indicator of BNB undoubtedly signals a bearish trend, as selling pressure continues with RSI moving along the oversold zone, with no sign of an instant bullish breakout.