Ripple’s XRP has seen a price decline totaling 6% over the past 24 hours of trading, bringing the current price for the coin down to around $0.3754 at press time. The cryptocurrency has lost a further 16% over the past 7 trading days.
This price drop largely is due to the retracement seen in Bitcoin, although XRP also has seen difficulty when priced against Bitcoin.
XRP currently is ranked in 3d place amongst the top cryptocurrency projects by market cap value, holding a $15.89 billion market cap, according to CoinMarketCap at time of publication.
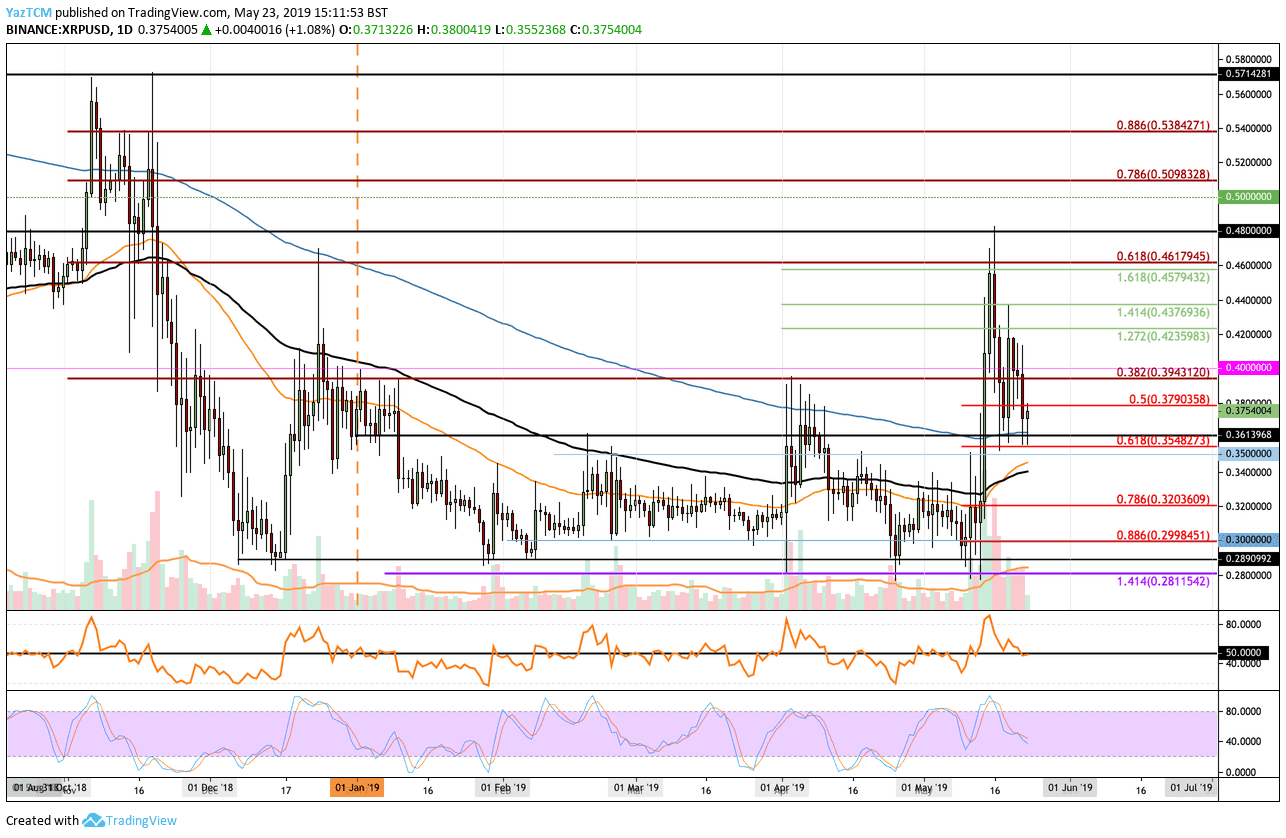
Looking at the XRP/USD 1-Day Chart:
- Since our previous XRP/USD analysis, we can see that XRP/USD has fallen further from the $0.39 level, to where it currently is trading at around $0.375. XRP has strong resistance beneath it provided by the 200-day moving average around the $0.3615 level.
- From above: The nearest levels of resistance lie at $0.3790 and $0.3943. If the bulls can continue further above $0.40, higher resistance can be located at $0.4235, $0.4376 and $0.4617. Above this, further resistance lies at $0.48 and $0.50.
- From below: The nearest level of support now sits between $0.36 and $0.35. Beneath $0.35, further support is located at $0.34, $0.32 and $0.30.
- Trading volume has dropped significantly from the average level seen during May 2019.
- The RSI is in a precarious position as it hovers around the 50 level which indicates indecision within the market. If the RSI drops beneath 50, we can expect XRP/USD to head lower.
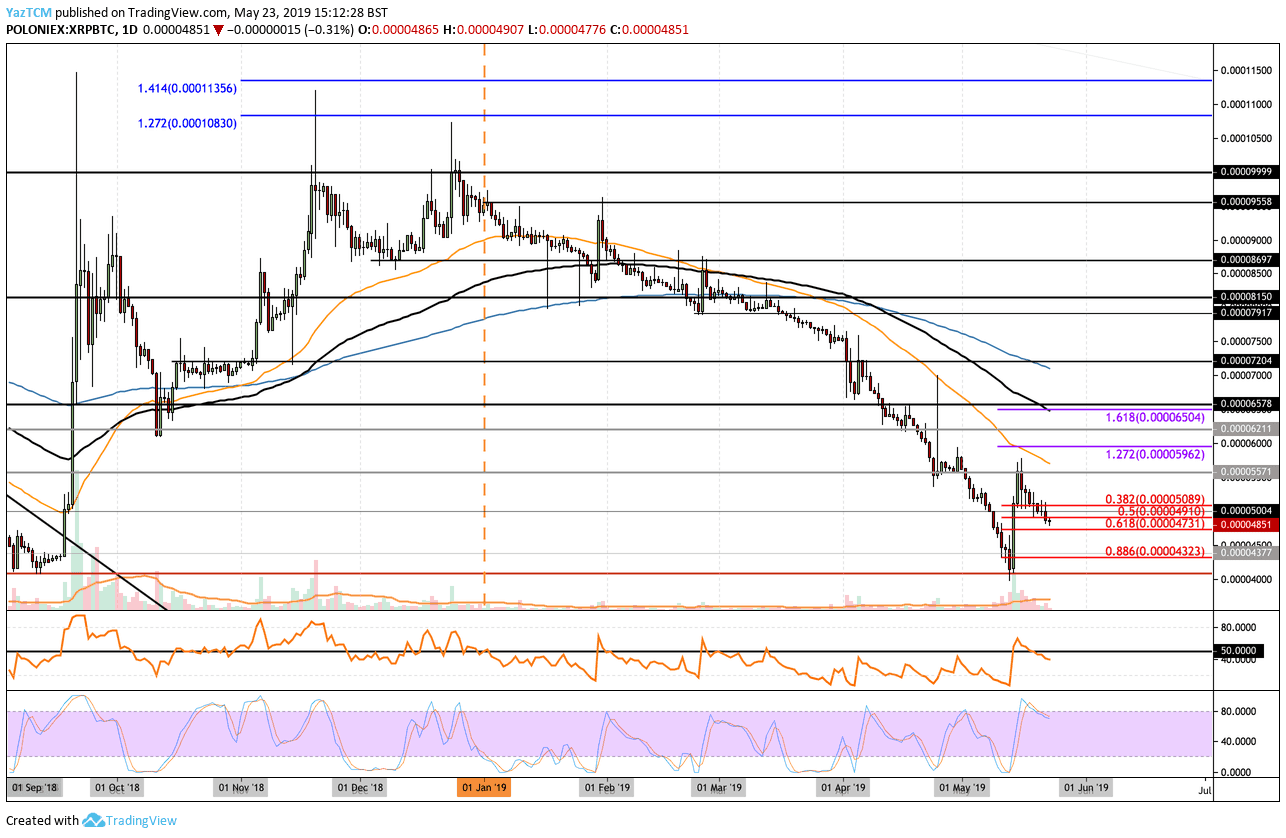
Looking at the XRP/BTC 1-Day Chart:
- Against Bitcoin, we can see XRP/BTC has now dropped further beneath the support at 5000 SAT to where it currently trades at press time, around 4850 SAT.
- From above: The nearest level of resistance now sits at 4910 SAT, 5000 SAT and 5090 SAT. Above 5100 SAT, further resistance exists at 5571 SAT, 5962 SAT and 6000 SAT.
- From below: The nearest level of support lies at 4731 SAT. Beneath this, further support is expected at 4500 SAT, 4323 SAT and 4000 SAT.
- Trading volume has also significantly declined toward the second half of May 2019.
- The Stochastic RSI suggests that price action will head further lower due to a bearish crossover in overbought conditions.