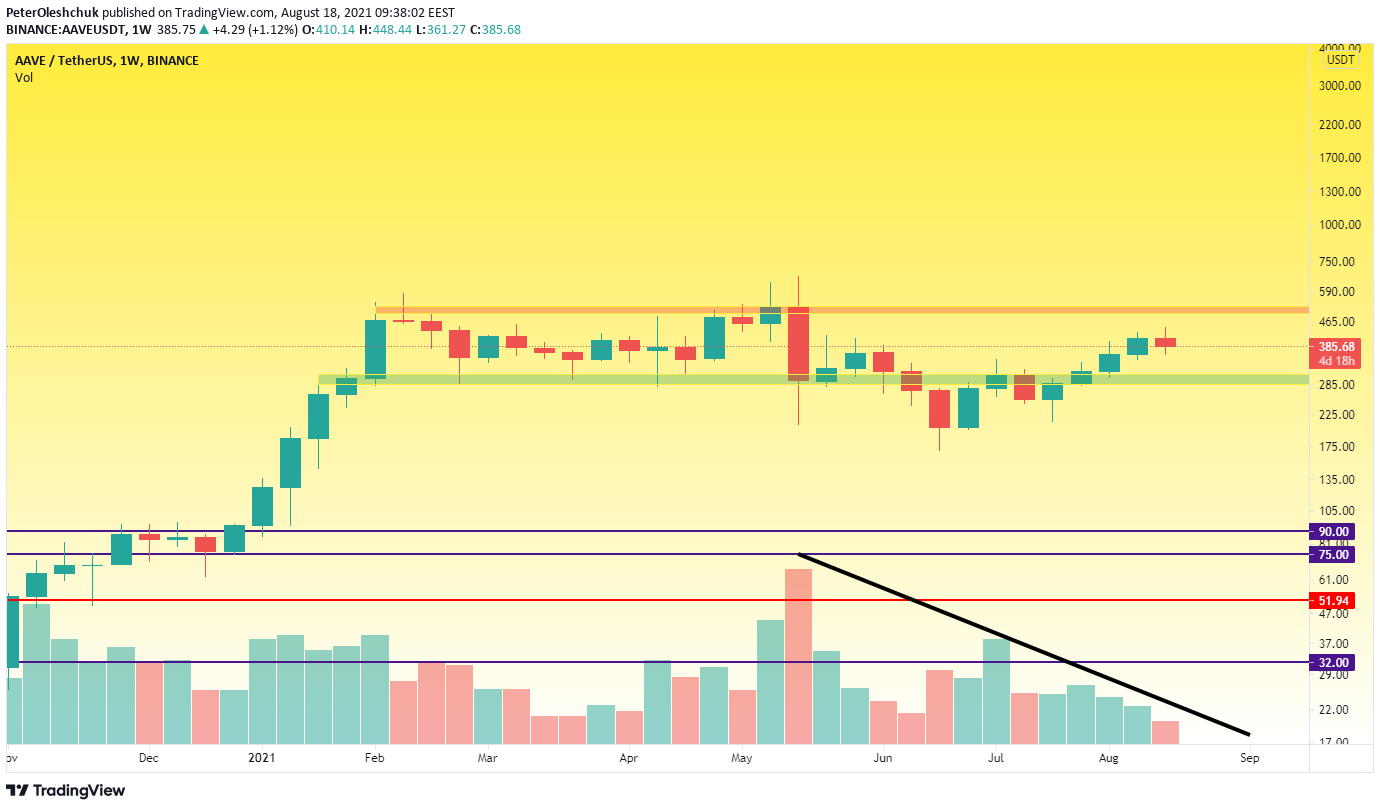
Despite the positive situation in the AAVE market over the past 7 weeks, the risks of the global correction continuation are quite high. Buyers again managed to get into the consolidation limits of $290-$516, from which the AAVE coin price broke down in May.

https://www.tradingview.com/x/owZ0wsyZ/
At the same time, trading volumes during the current price growth are twice less than the volumes due to which buyers pushed the AAVE price up since January.
Interestingly, the trading volumes decreased in the last three weeks, although the AAVE price was in the illiquid price zone. In such ranges, price growth is usually accelerated because there are no obstacles. This fact does not emphasize the strength of buyers who plan to build a new growth wave.
AAVE Technical Analysis on the Daily Timeframe
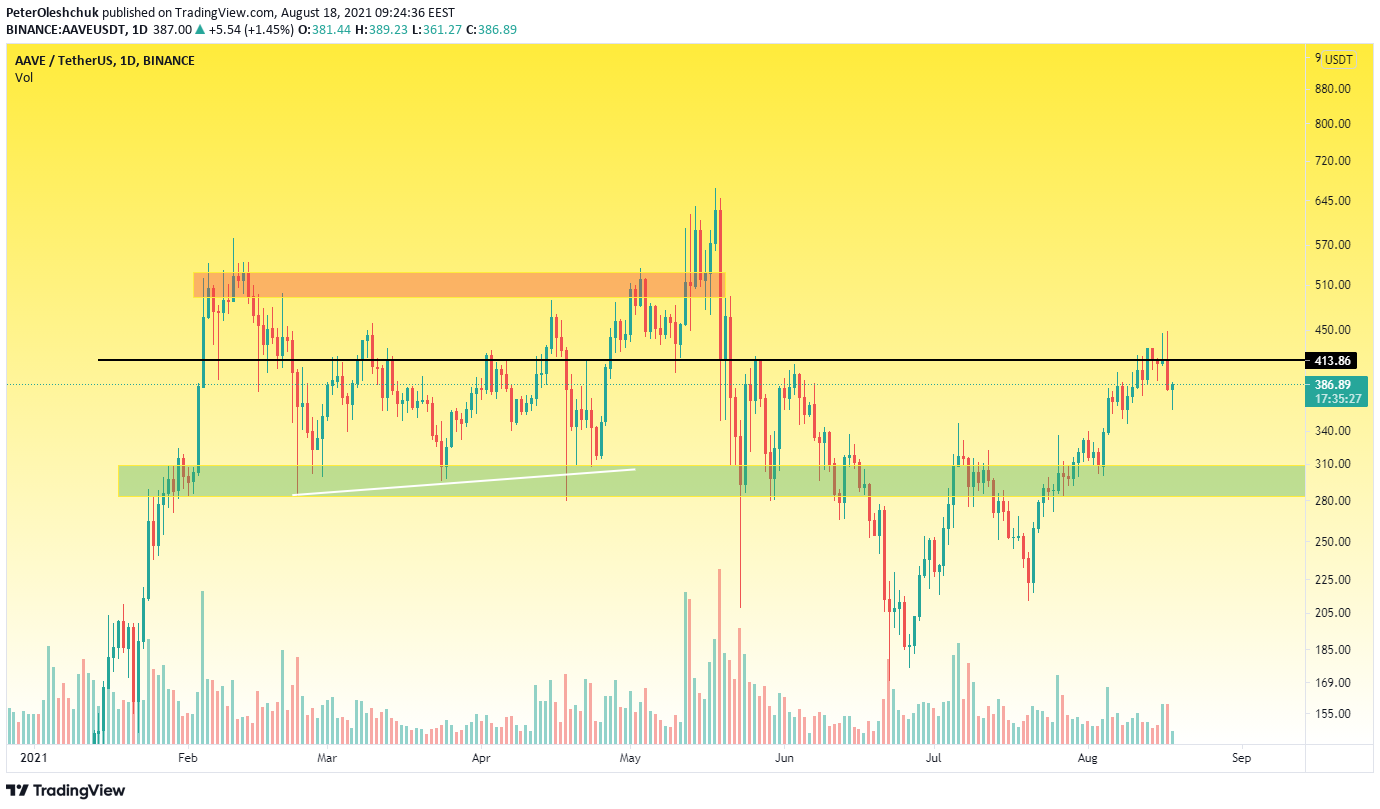
If you analyze the daily chart, in addition to the uncertainty of buyers, you can see the complete passivity of sellers. In the range of $413-$420 sellers became more active, showing their interest in this range:

https://www.tradingview.com/x/jtjax5jN/
The previous two days traded at increased volumes and closed with pins up. Yesterday's candle closed below the opening price by 8%, hinting at a continued fall. However, buyers have shown readiness to keep the mark of $360 today. This mark is the only obstacle for sellers on the way to the range of $290-$300.
If sellers have shown all the power they have, then by the end of the week, we will see a new local AAVE crypto growth wave and attempts to break the $413-$430 range. Though, for a strong long-term growth wave, it would be much better if the price still tested the range of $290-$300 within the current correction. Confirmation of buyers' control over this liquidity zone will give a clear signal to long-term investors to enter the market.
AAVEBTC Price Is in a Difficult Situation
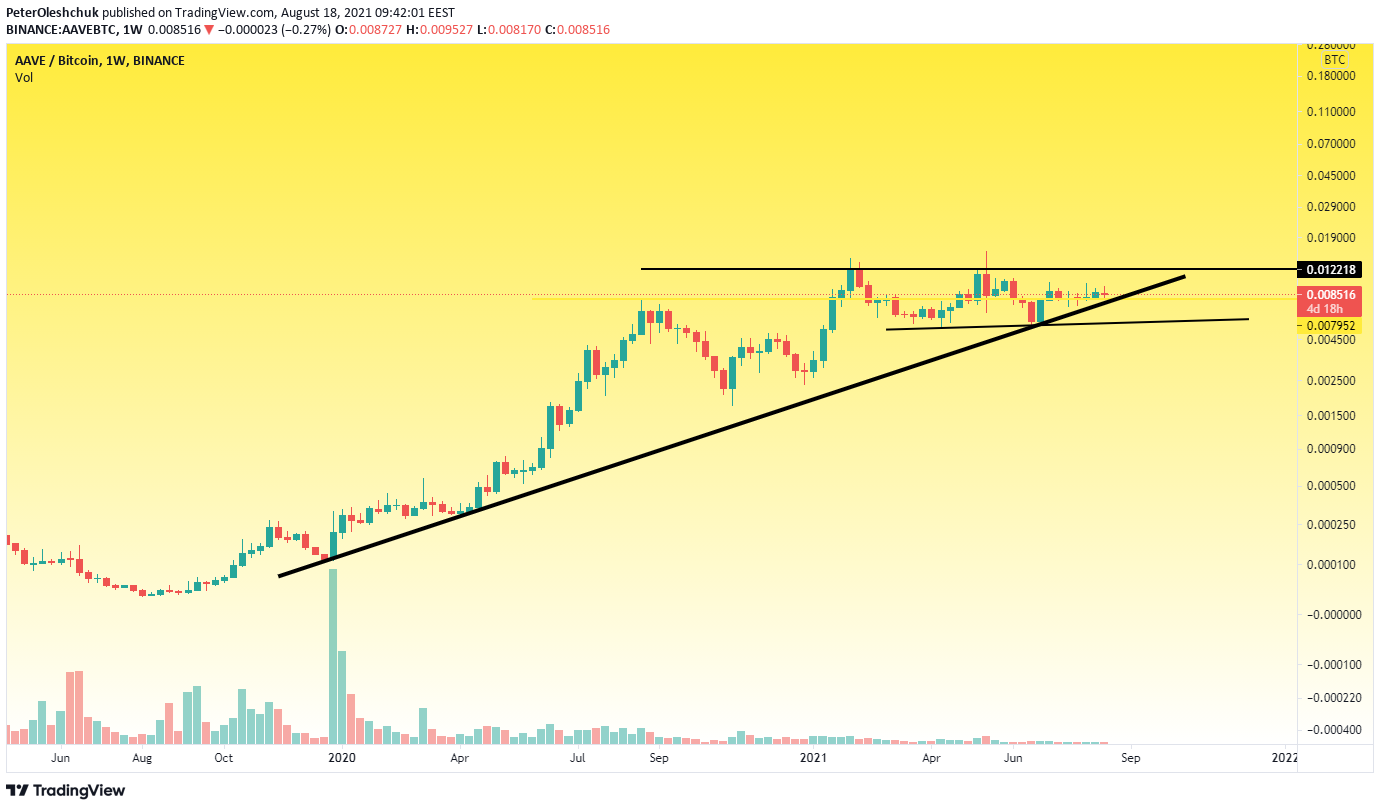
Analyzing the situation on the AAVEBTC chart, we have noticed a serious aggravation of the situation within the global trend line of buyers.

https://www.tradingview.com/x/d4chk9F1/
As we see in the chart, the price has been trading in a narrow consolidation for 7 weeks and is at a crossroads. Having lost the global trend line, which reflected all the attacks of sellers since December 2019, buyers will have to defend in the range of 0.0023. For the AAVEUSDT price, this will mean updating the local low and continuing the global price correction.
Therefore, only after breaking the mark of 0.012 up, the AAVE market will confidently declare its readiness to continue growth. At the moment, the price is at a point of uncertainty, which is worth waiting for.
 cryptoknowmics.com