The XRP Technical Analysis shows a double-bottom forming within the consolidation range, teasing a breakout above the $0.51 resistance level. The XRP price action displays a consolidation range between the $0.42 support level and the overhead resistance of the $0.50 psychological mark. However, the growing bullish influence over the sideways trend projects a double-bottom pattern forming at the $0.42 support level, with the neckline at the $0.51 mark. So, should you consider taking a bullish entry or wait till the uptrend sabotages the higher price rejection candles?
Key Points:
- The Ripple price action shows an uptrend growing but with higher price rejection candles.
- The bullish breakout of $0.51 will extend the recovery rally.
- The intraday trading volume in Ripple is $2.60 billion.
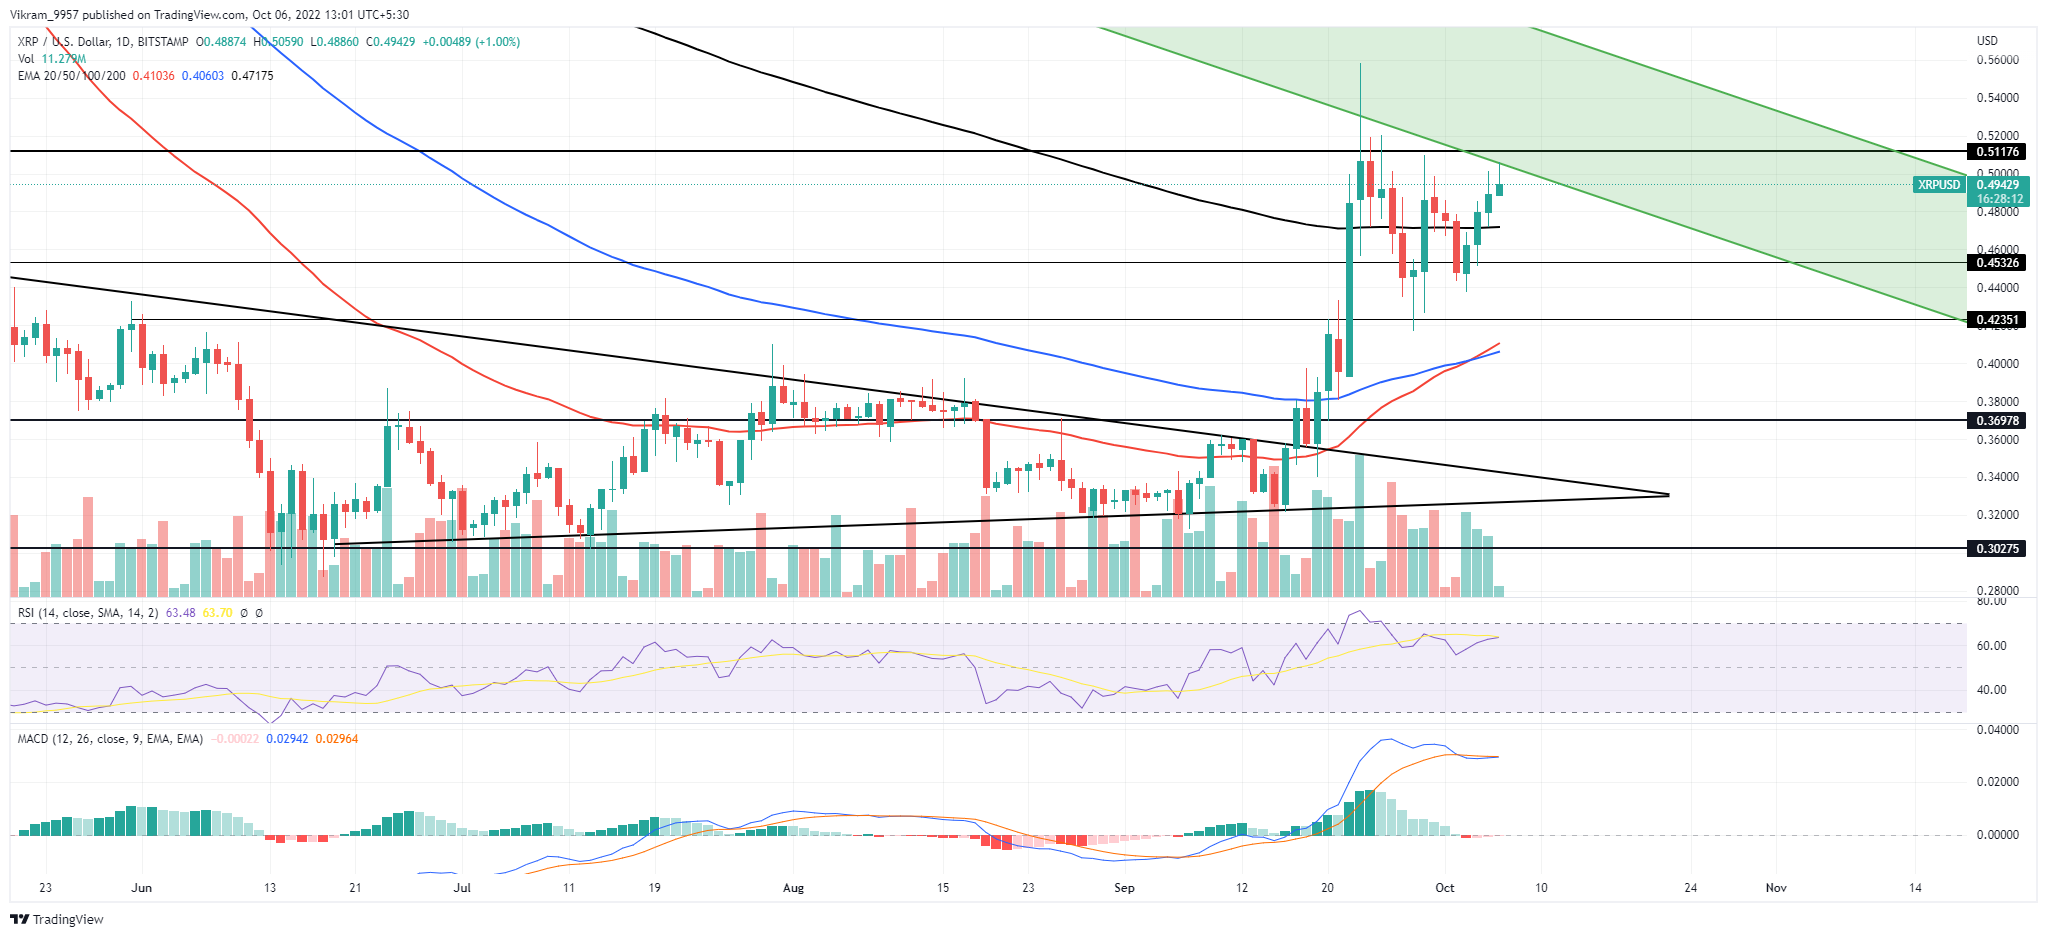 Source - TradingView
XRP Technical Analysis
As we mentioned in our previous analysis, the XRP price rains down to the bottom support level of $0.42 with a 10% drop within 72 hours. But with the lower price rejection, the trend manages to recover, resulting in a double bottom pattern with the neckline at the $0.51 mark. Currently, the price action displays a 10.42% jump in the last four days leading to a streak of four bullish candles. However, the higher price rejection in these bullish candles reflects a strong selling opposition. The daily candle shows a growth of 1.30%, but the long-wick formation projects a higher price rejection. If the uptrend finds bullish momentum to Break above the $0.51 mark, The breakout rally will potentially reach the $0.59 mark accounting for the 15% jump. Conversely, the sideways trend will prolong if XRP prices fall back to the $0.42 mark.
Technical Indicators
The RSI slope displays a bearish divergence with the price action, reflecting a high possibility of a bearish turnaround. Also, the MACD and signal lines are merged to continue the neutral trend. Therefore, the momentum indicators forecast a high possibility of a bullish failure leading to a downtrend. As a result, the XRP technical analysis warns the buyers hoping for an uptrend. Resistance Levels - $0.51 and $0.59 Support Levels - $0.42 and $0.36