Bitcoin (BTC) is approaching a confluence of resistance levels between $46,950 and $47,750.
Ethereum (ETH) has reclaimed the $2,850 resistance level but is facing resistance at $3,360.
XRP (XRP) has broken out from an ascending parallel channel.
Monero (XMR) has broken out from a descending resistance line.
Chiliz (CHZ) has reclaimed the midline of a descending parallel channel and is moving towards its resistance line.
Binance Coin (BNB) has reclaimed the $330 horizontal area.
Aave (AAVE) has reclaimed the $310 horizontal area.
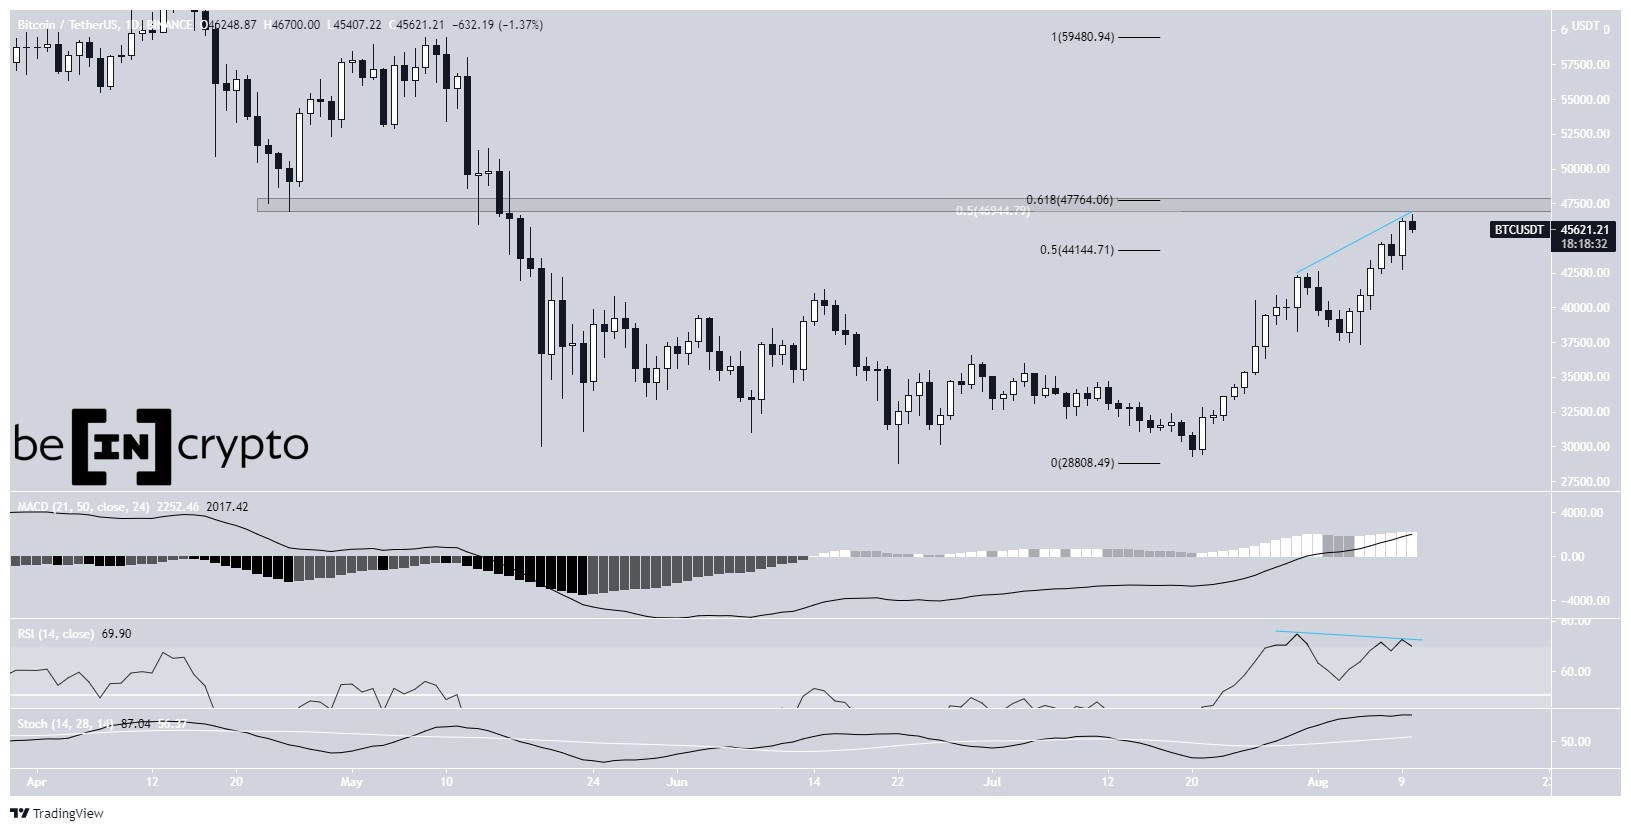
BTC
BTC has been moving upwards since June 22 and created a higher low on July 20 before accelerating.
While it has moved above the 0.5 Fib retracement resistance level (black) at $44,144, it’s now approaching a significant confluence of resistance levels.
The main resistance is found between $46,950 and $47,750. This range is created by the long-term 0.5 Fib retracement resistance level (white), the 0.618 short-term Fib retracement resistance level (black), and a horizontal resistance area.
The daily RSI has already begun to generate a bearish divergence, therefore some sort of retracement is expected once BTC gets to this level.
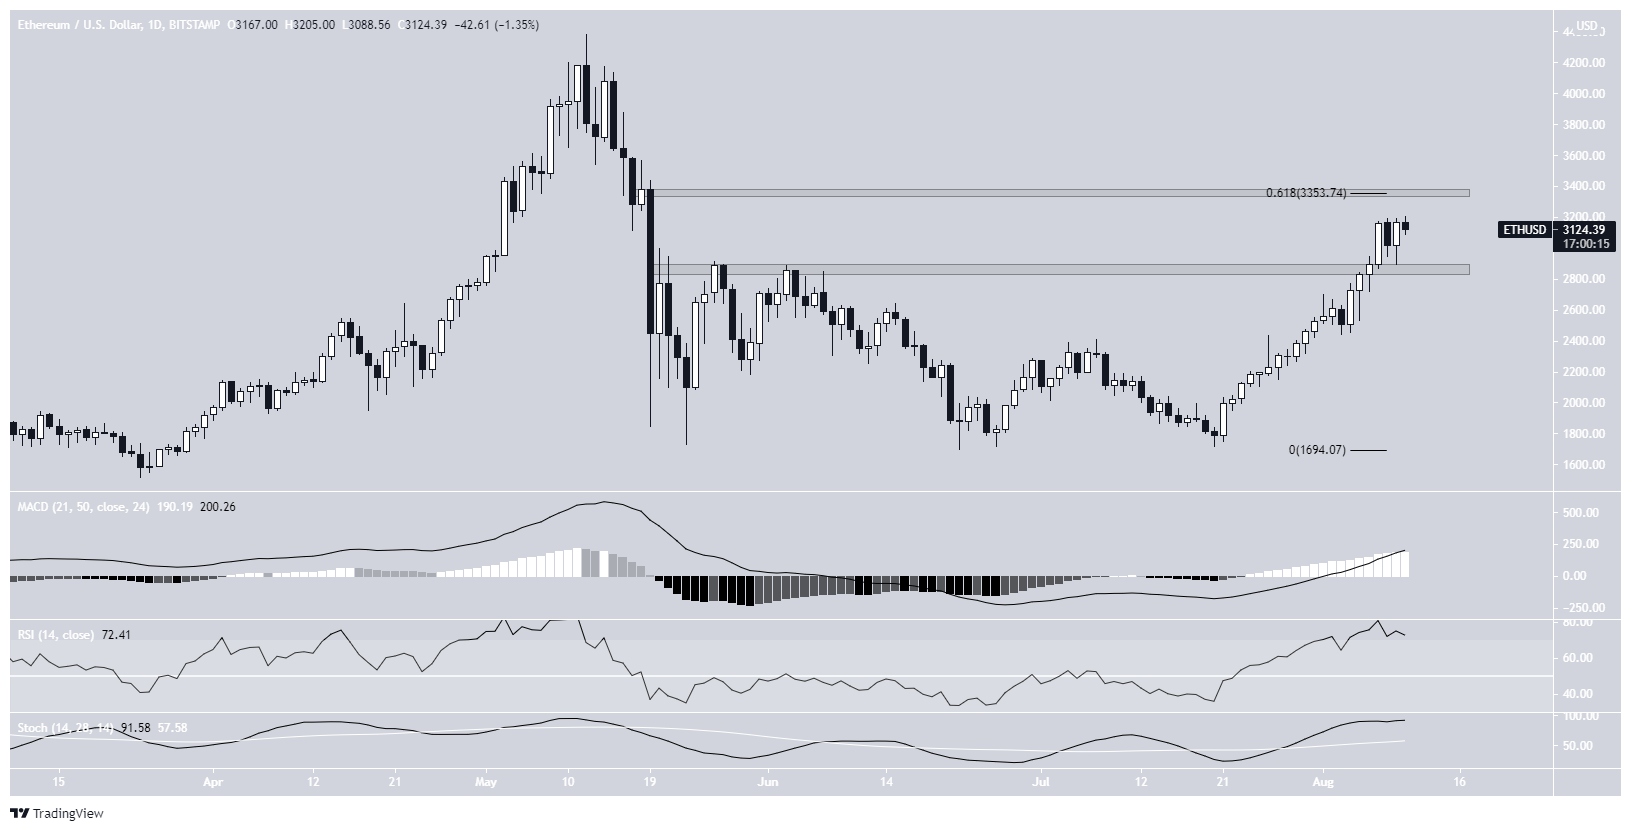
ETH
ETH has been moving upwards at a rapid rate since creating its first higher low on July 20. On Aug 6, it managed to reclaim the $2,850 horizontal resistance area and validated it as support two days later.
However, it’s facing resistance at $3,350. This is the 0.618 Fib retracement resistance level and a horizontal resistance area.
While the RSI is overbought, technical indicators are not showing any signs of weakness yet, indicating that the upward trend is still intact.
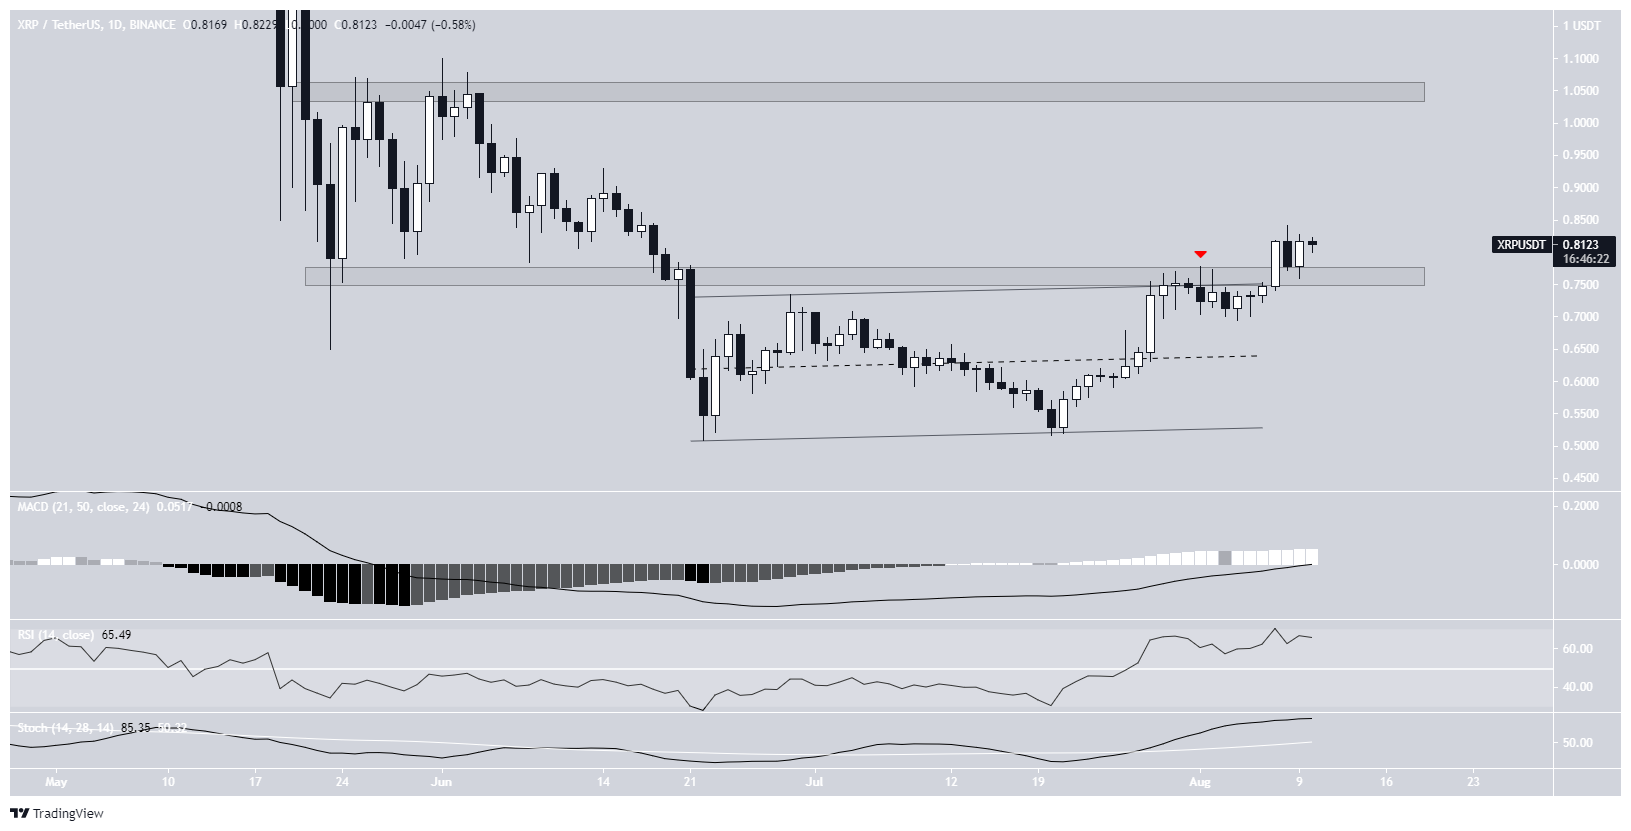
XRP
XRP had been trading inside an ascending parallel channel since reaching a low on June 22. On July 31, it was rejected by the resistance line of the channel and the $0.80 horizontal resistance area.
However, it managed to break out on Aug 7 and validated the $0.80 area as support.
Technical indicators are bullish. The MACD is moving upwards and has just crossed into positive territory ans the RSI and Stochastic oscillator are also increasing.
The next closest resistance area is found at $1.05.
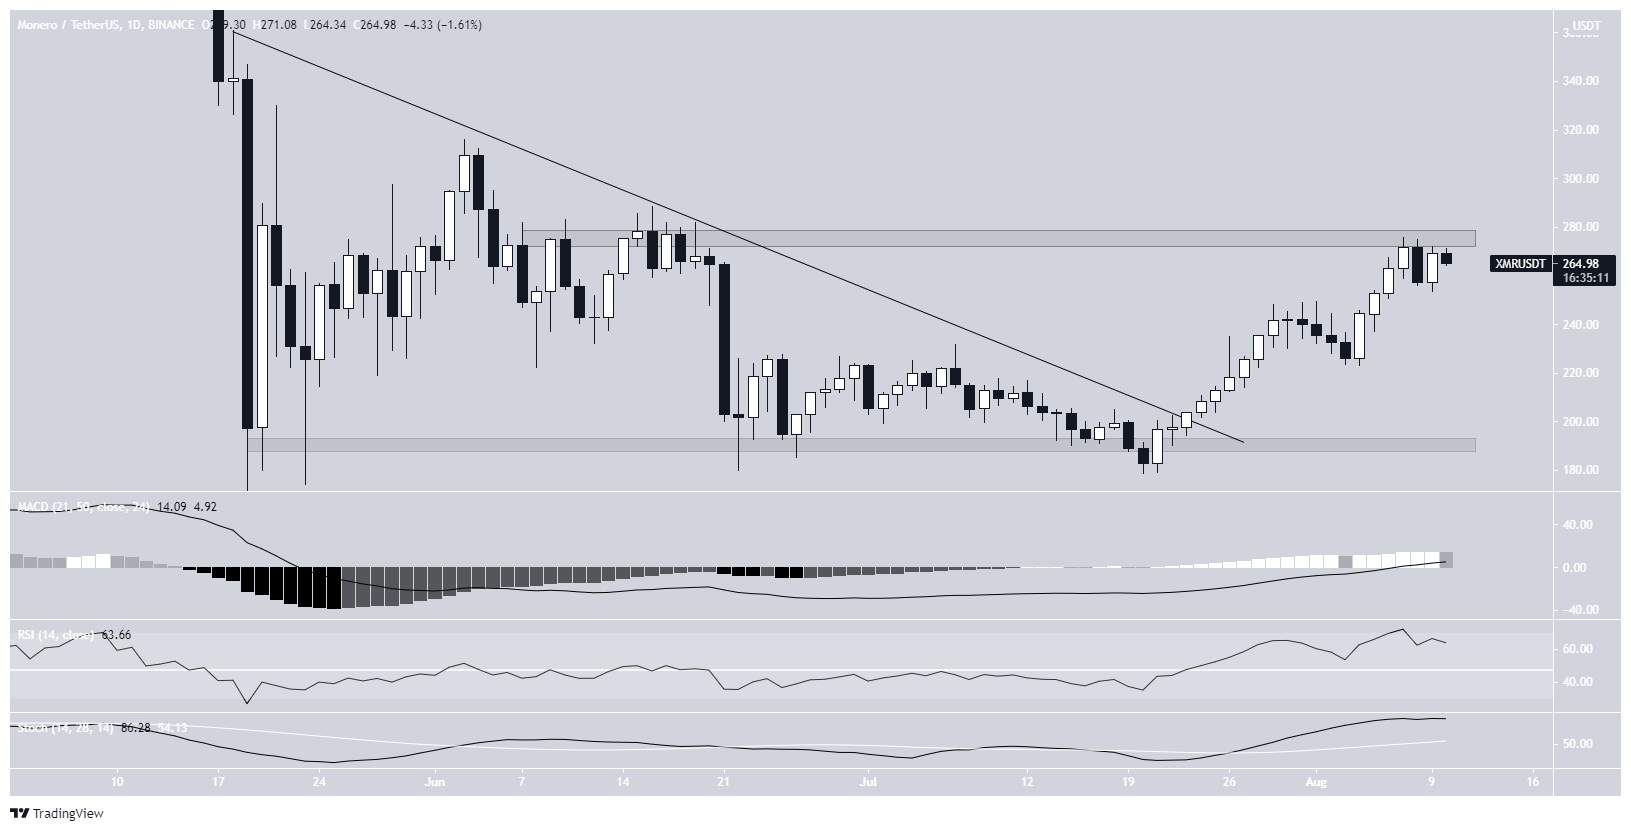
XMR
XMR has been increasing since July 22 after deviating below the $190 horizontal support area. On July 24, it broke out from a descending resistance line and accelerated.
It’s currently trading close to the $280 resistance area. An increase above this level could trigger another sharp upward move.
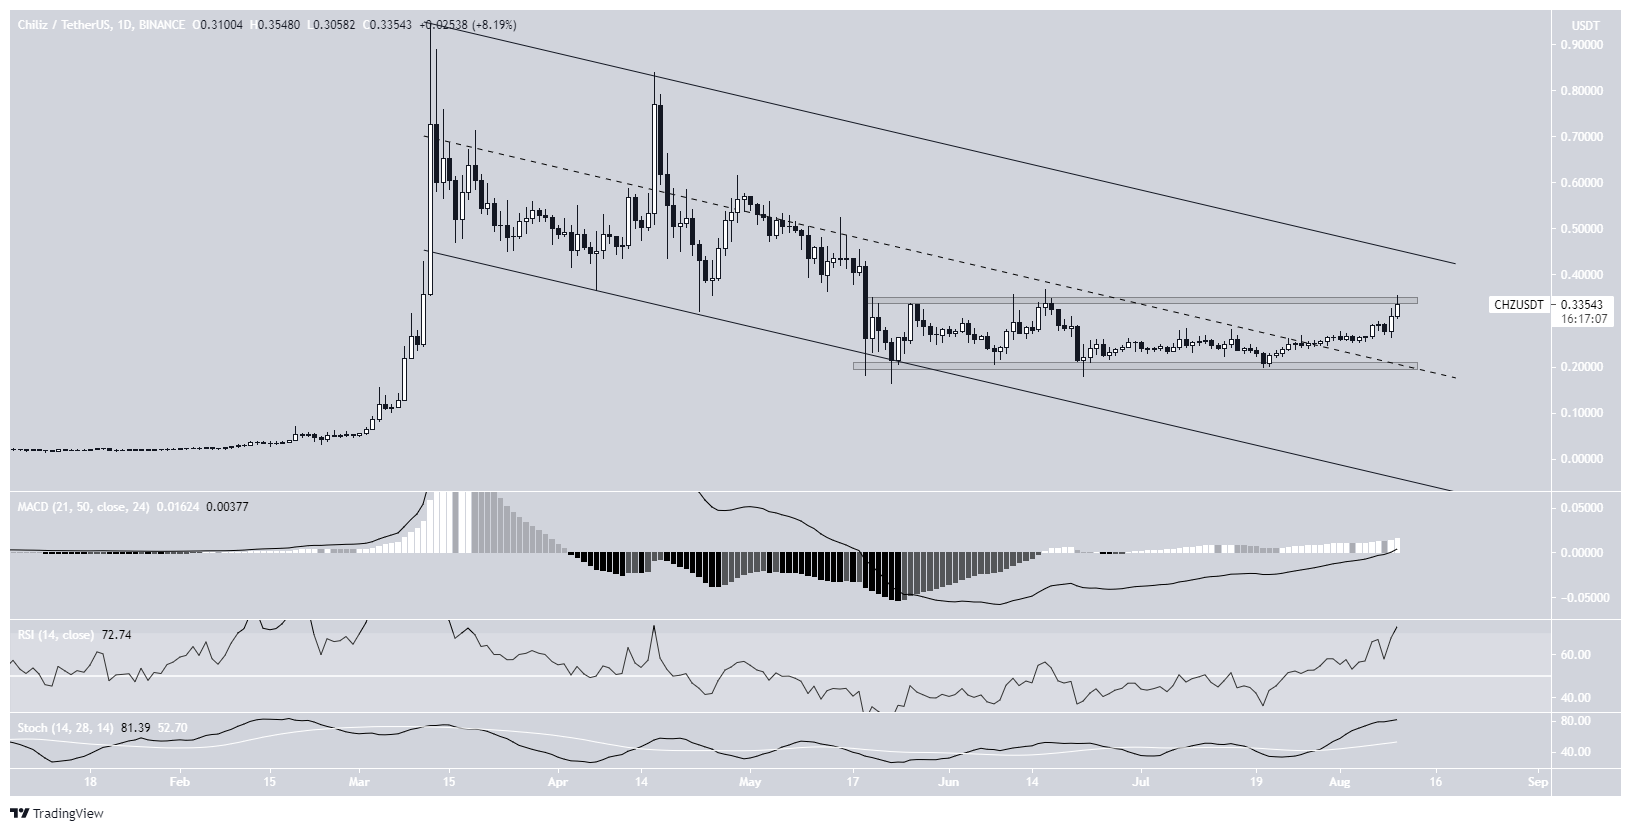
CHZ
CHZ has been decreasing inside a descending parallel channel since March 12. On May 23, it bounced at the support line of the channel and $0.20 horizontal support area.
After a long period of consolidation, it reclaimed the midline of the channel and is now attempting to break out from the $0.34 resistance area.
Doing so would likely lead to an attempt at breaking out above the channel.
Technical indicators in the daily time-frame are bullish and support the probability of this transpiring.
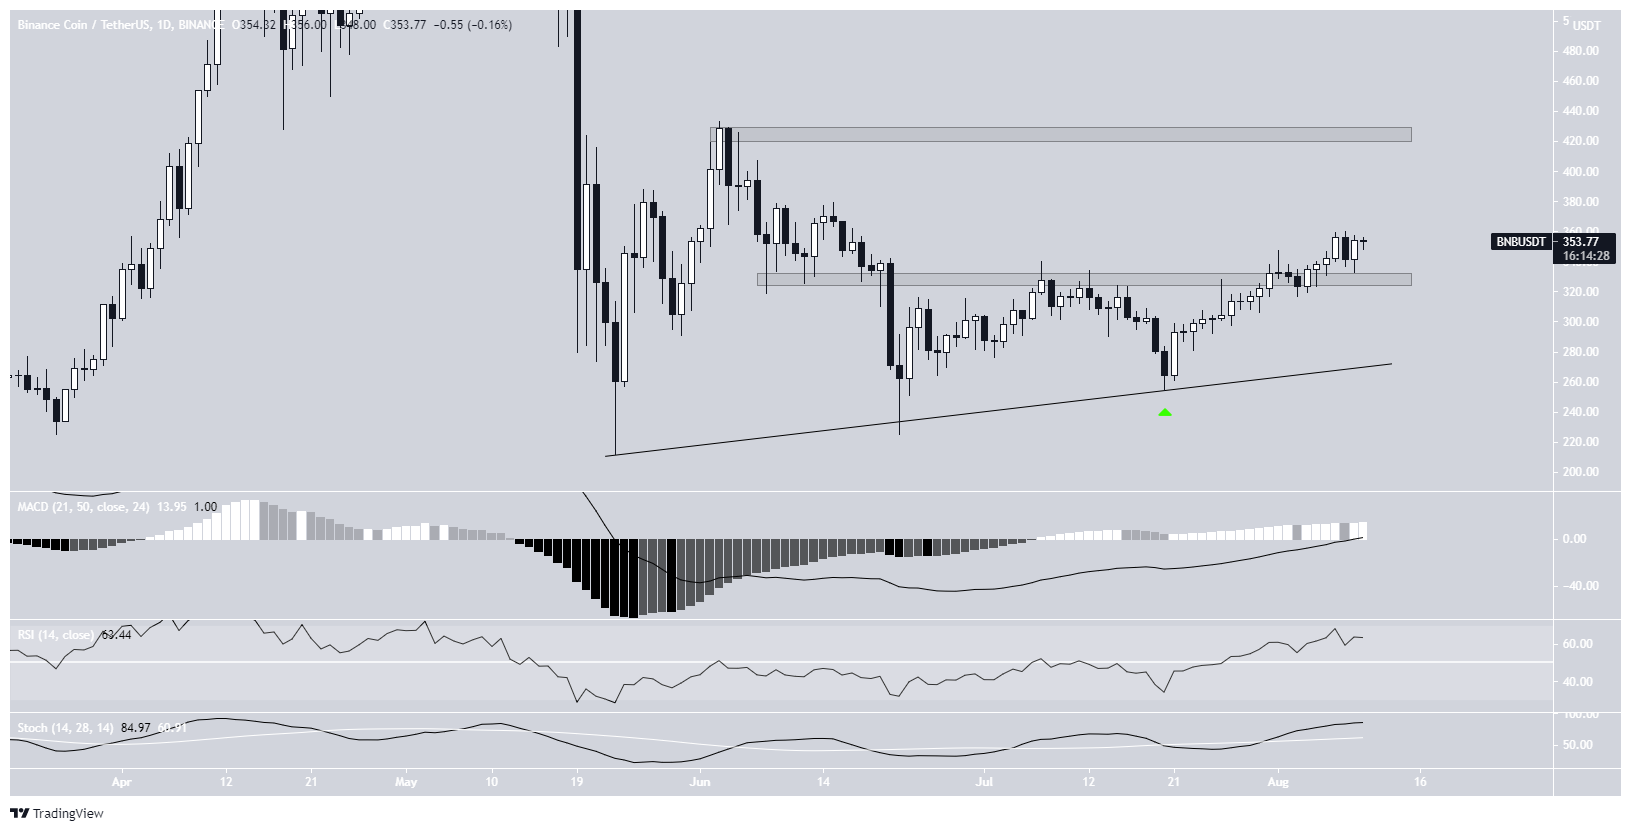
BNB
BNB has been increasing alongside an ascending support line since May 23. It bounced from this line on July 20 and has been increasing since.
On Aug 4, it reclaimed the $330 horizontal area and validated it as support after. Technical indicators are also bullish, supporting the continuation of the upward move.
The next resistance is found at $425.
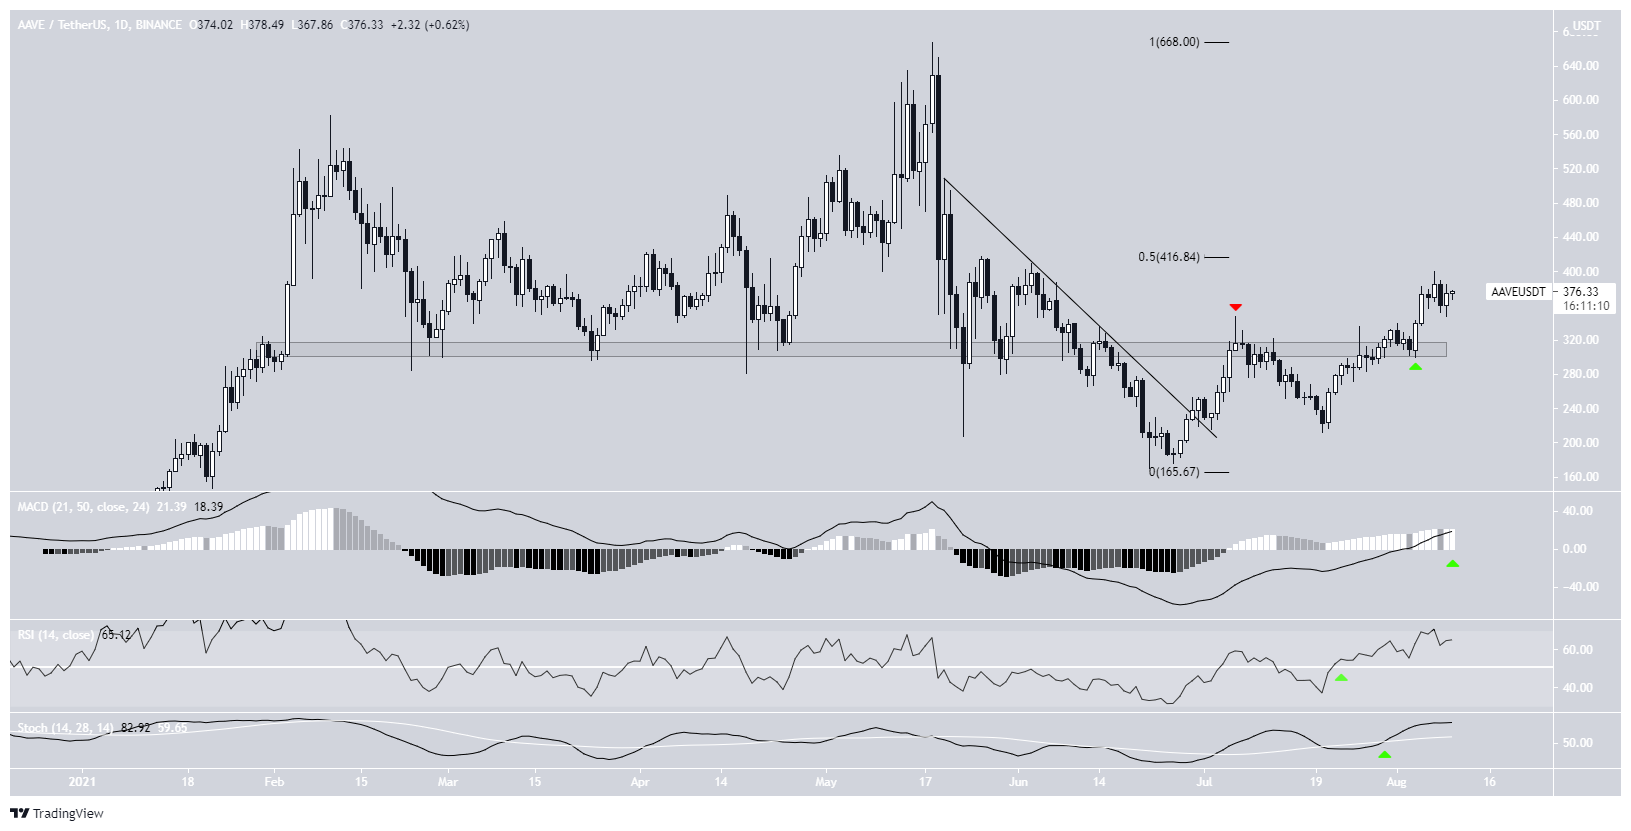
AAVE
AAVE has been increasing since breaking out from a descending resistance line on June 29. The upward move led it to reach the $305 horizontal resistance area, which initially caused a rejection (red icon).
However, after creating a higher low, AAVE managed to break out and validate the area as support (green icon).
It’s currently attempting to move above the 0.5 Fib retracement resistance level. Technical indicators are bullish and supporting the liklihood of this happening.