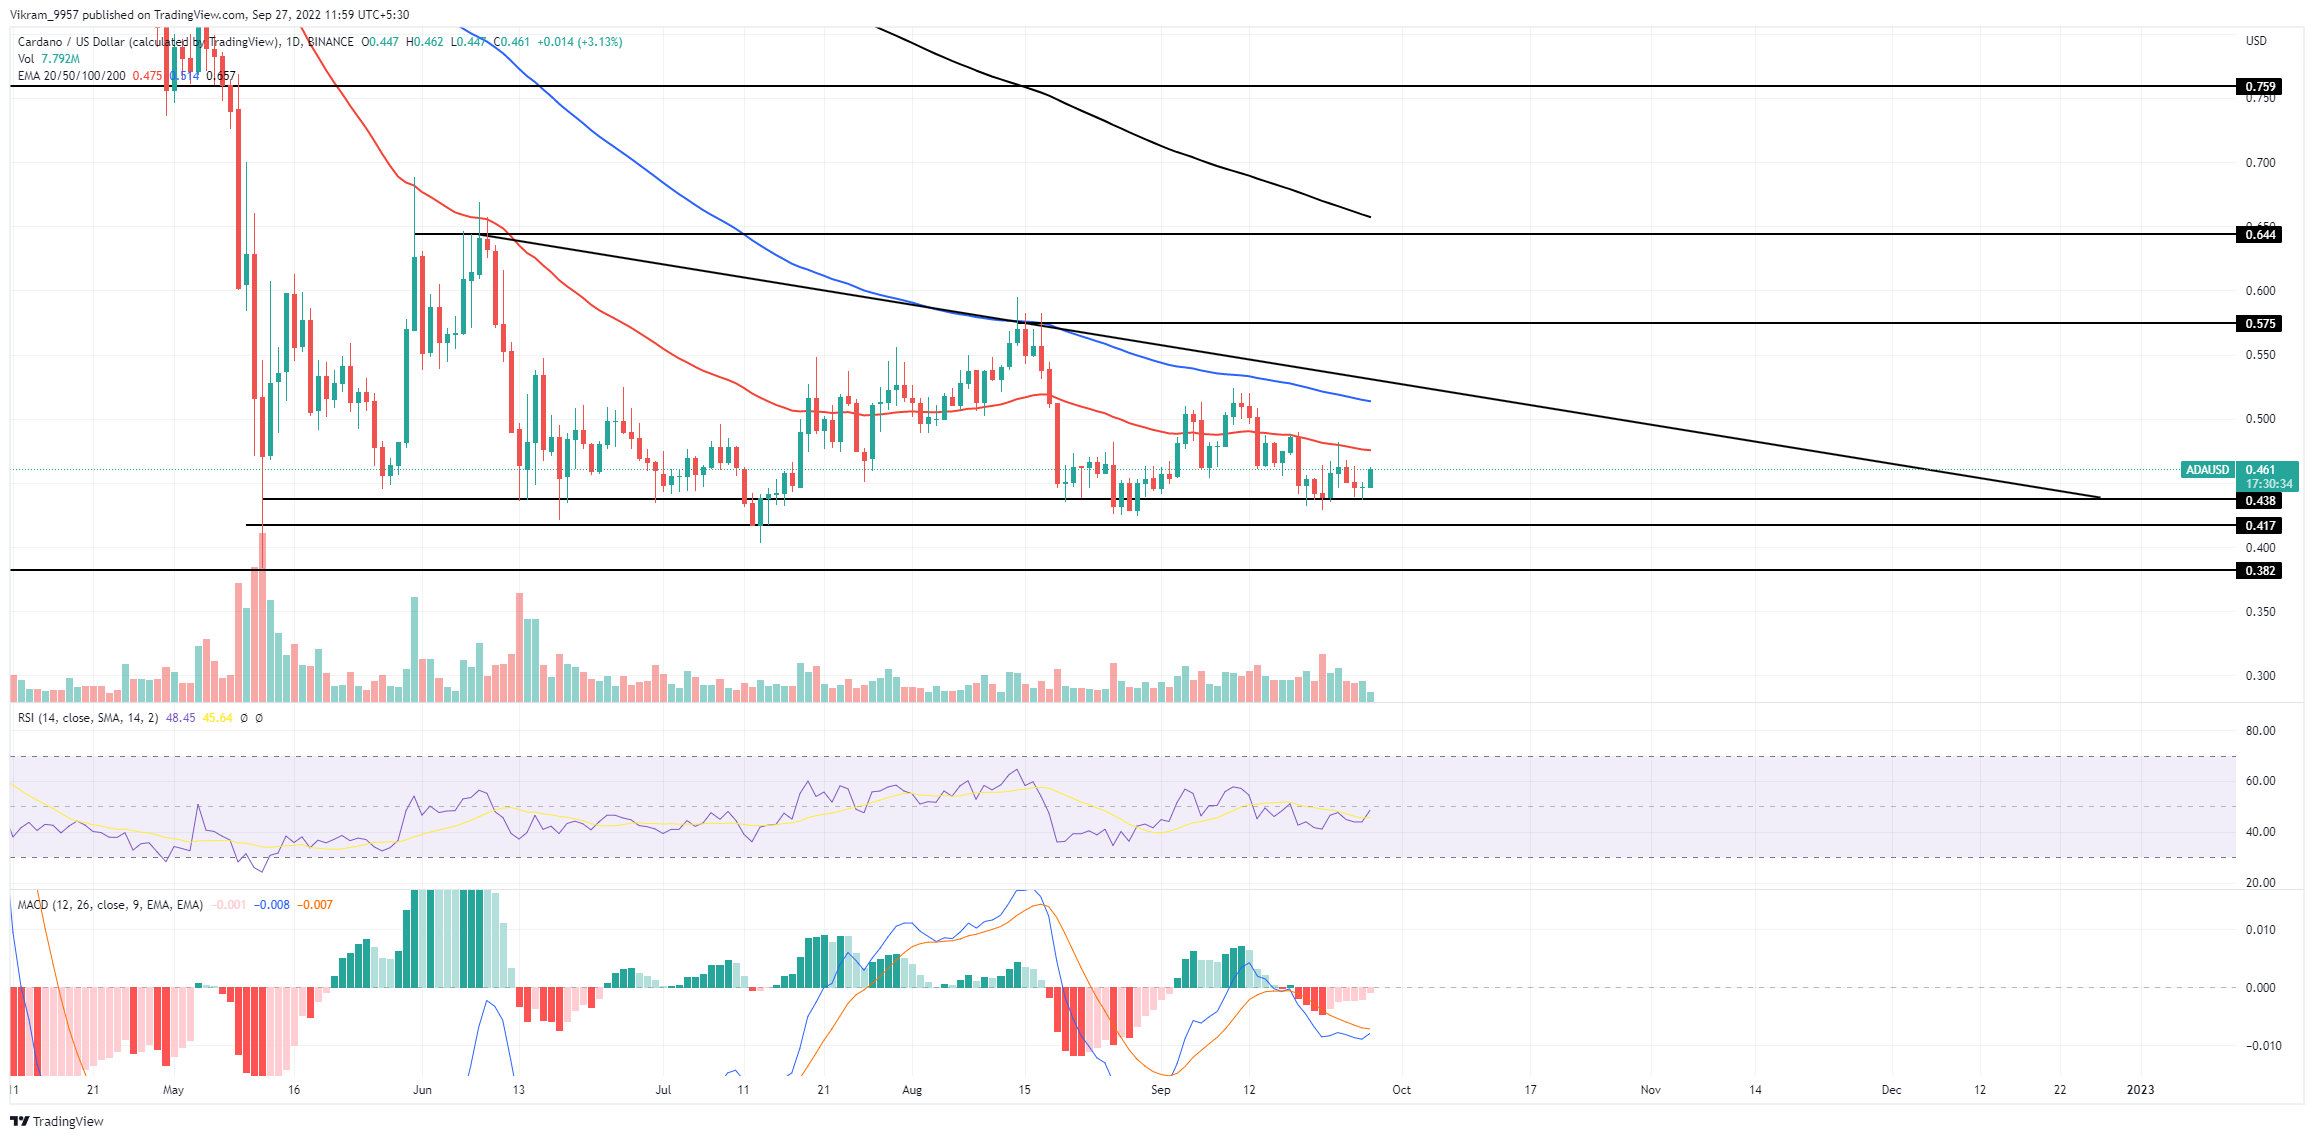
The ADA Technical Analysis shows a double bottom pattern forming at the $0.43 support level, teasing a bullish entry to capture the reversal rally. The ADA price action shows a bullish reversal possibility within a triangle pattern leading to a price jump to the trendline. Currently, the Cardano price action on the technical chart offers the case of a double bottom reversal contesting the 50-day EMA. So should you consider buying Cardano as the prices sustain above $0.43?
Key Points:
- The Cardano prices show a bull cycle challenging the 50-day EMA.
- The reversal within the triangle offers a double-bottom possibility.
- The intraday trading volume in Cardano is $672 million.
 Source - TradingView
ADA Technical Analysis
As mentioned in our previous analysis, the ADA price sustains above $0.43, leading to a double bottom in the technical chart. Furthermore, the ADA price action displays a 3.13% jump leading to a bullish engulfing candle. The bullish candle helps form a morning star pattern that may shortly lead to a positive turnaround within the triangle pattern. However, the reversal rally faces opposition from the 50-day EMA while the trend in trading volume declines. Hence, the recovery rally shows an underlying weakness which may fail to exceed the 50-day EMA, leading to higher price rejection. Sideline traders must wait for price action confirmation before taking a bullish entry. If the uptrend drives the ADA prices above the double bottom neckline at $0.4, traders can expect the reversal rally to jump to the resistance trendline and can find a rise of 10-12% upon a bullish breakout. Otherwise, a reversal will again test the $0.43 support level, endangering the $0.38 bottom.
Technical Indicators
The daily-RSI slope approaches the halfway line with a rounding reversal, reflecting an improvement in the underlying sentiments. Moreover, the MACD indicator shows the fast and slow lines ready to give a bullish crossover to start a positive trend in histograms. Therefore, the momentum indicators support the possibility of a bullish trend continuation, Resistance Levels - $0.46 and $0.50 Support Levels - $0.43 and $0.38