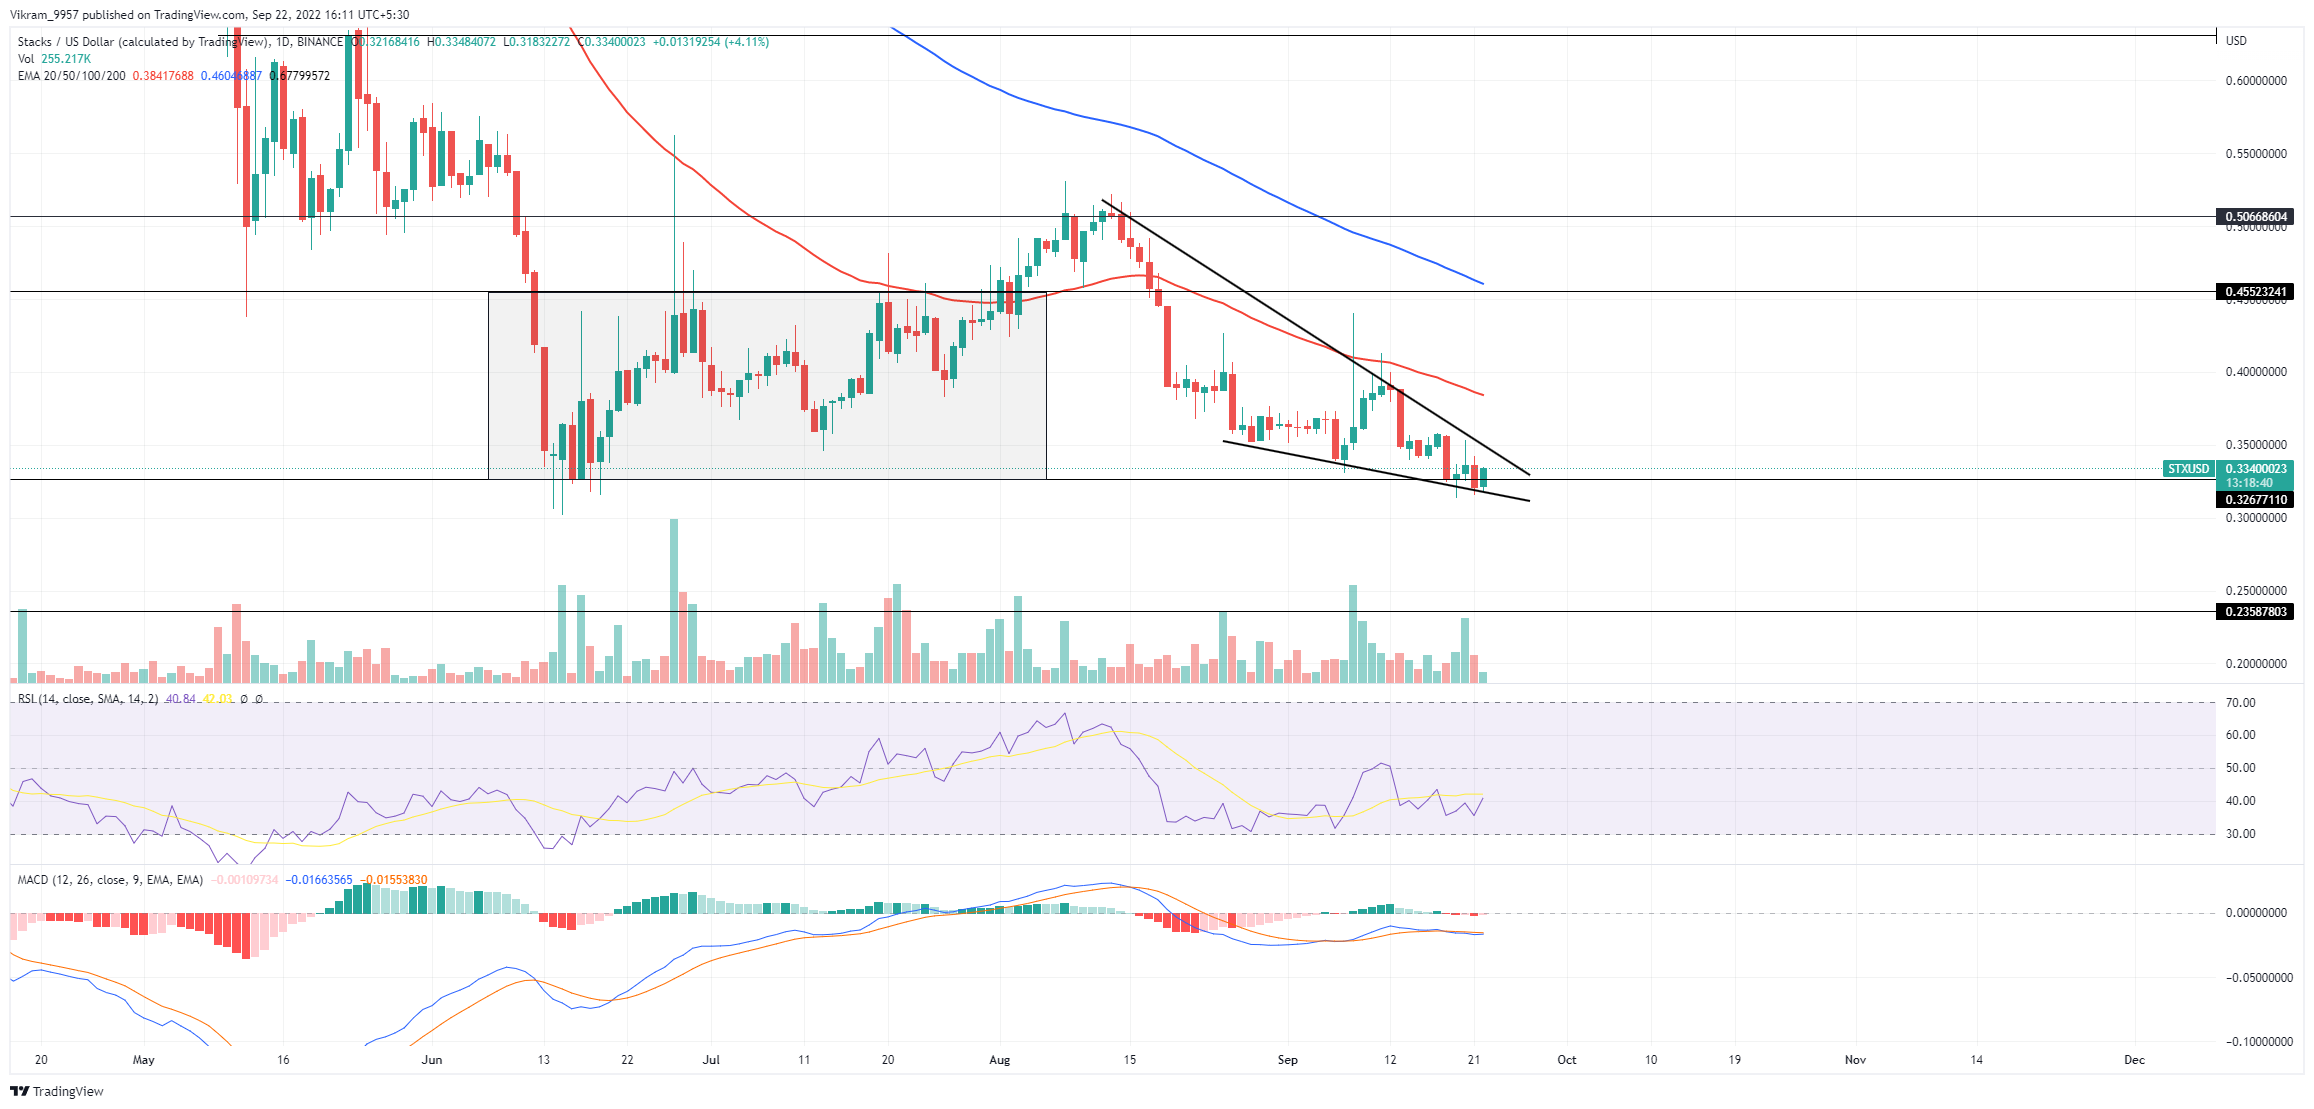
The STX Technical Analysis displays a falling trend within a bearish channel, leading the market value to the $0.22 mark. The STX price action shows a bearish breakout of the $0.45 mark resulting in a falling wedge pattern and a drop to the $0.33 mark. The recent bull cycle starting with the bearish pattern teases a bullish breakout, but the lack of trading volume doubts the buyer's interest. So should you be interested in a bullish reversal or wait for a selling opportunity?
Key Points:
- The Stacks prices show a bull cycle heating up at the support trendline.
- The bull run can result in a bullish breakout.
- The intraday trading volume in Stacks is $12.3 million.
 Source - TradingView
STX Technical Analysis
As mentioned in our previous analysis, the STX price shows the $0.45 breakout resulting in a price drop to the $0.32 mark. Currently, the downtrend accounts for a price drop of 28% within a month and forms a falling wedge pattern. The STX price action displays the bullish reversal for the falling wedge's support trendline, teasing the potential bullish breakout. Generally, this bearish pattern gives an upside breakout, but the lack of bullish support in the intraday trading volume questions the general trend. With a growth of 4.11%, the daily candle shows a bullish reversal from the support trendline, starting a bull run that may test the overhead resistance trendline shortly. Therefore, short-term traders can expect a short-term long entry opportunity to ride the bull cycle within the falling channel. However, the traders hoping to ride the breakout rally must wait for the daily candle to close above the resistance trendline. A prolonged uptrend might result in a price jump to the $0.45 resistance level, accounting for a price dump of 30%. On the other hand, the bearish breakout will crash the STX market value, dumping it to the bottom support of $0.23.
Technical Indicators
The sideways moving RSI slope below the 14-day SMA in the nearly oversold zone reflects a solid underlying bearishness in the STX price chart. However, the negligible gap between the MACD and signal lines teases a bullish crossover. Resistance Levels - $0.35 and $0.45 Support Levels - $0.33 and $0.23
 cryptoknowmics.com