The SNX Technical Analysis shows a potential bullish reversal as buyers sustain dominance over the $2.2 crucial support level. The SNX price displays a long-term downtrend after facing rejection from the 200-day EMA to reach the crucial support level of $2.2. However, the recent bullish candle forming at the $2.20 support level projects the possibility of a short-term bullish reversal. So, should you consider buying Synthetix?
Key Points:
- The Synthetix prices show a bull cycle heating up at the support trendline.
- The double bottom can result in a bullish breakout.
- The intraday trading volume in Synthetix is $64.4 million.
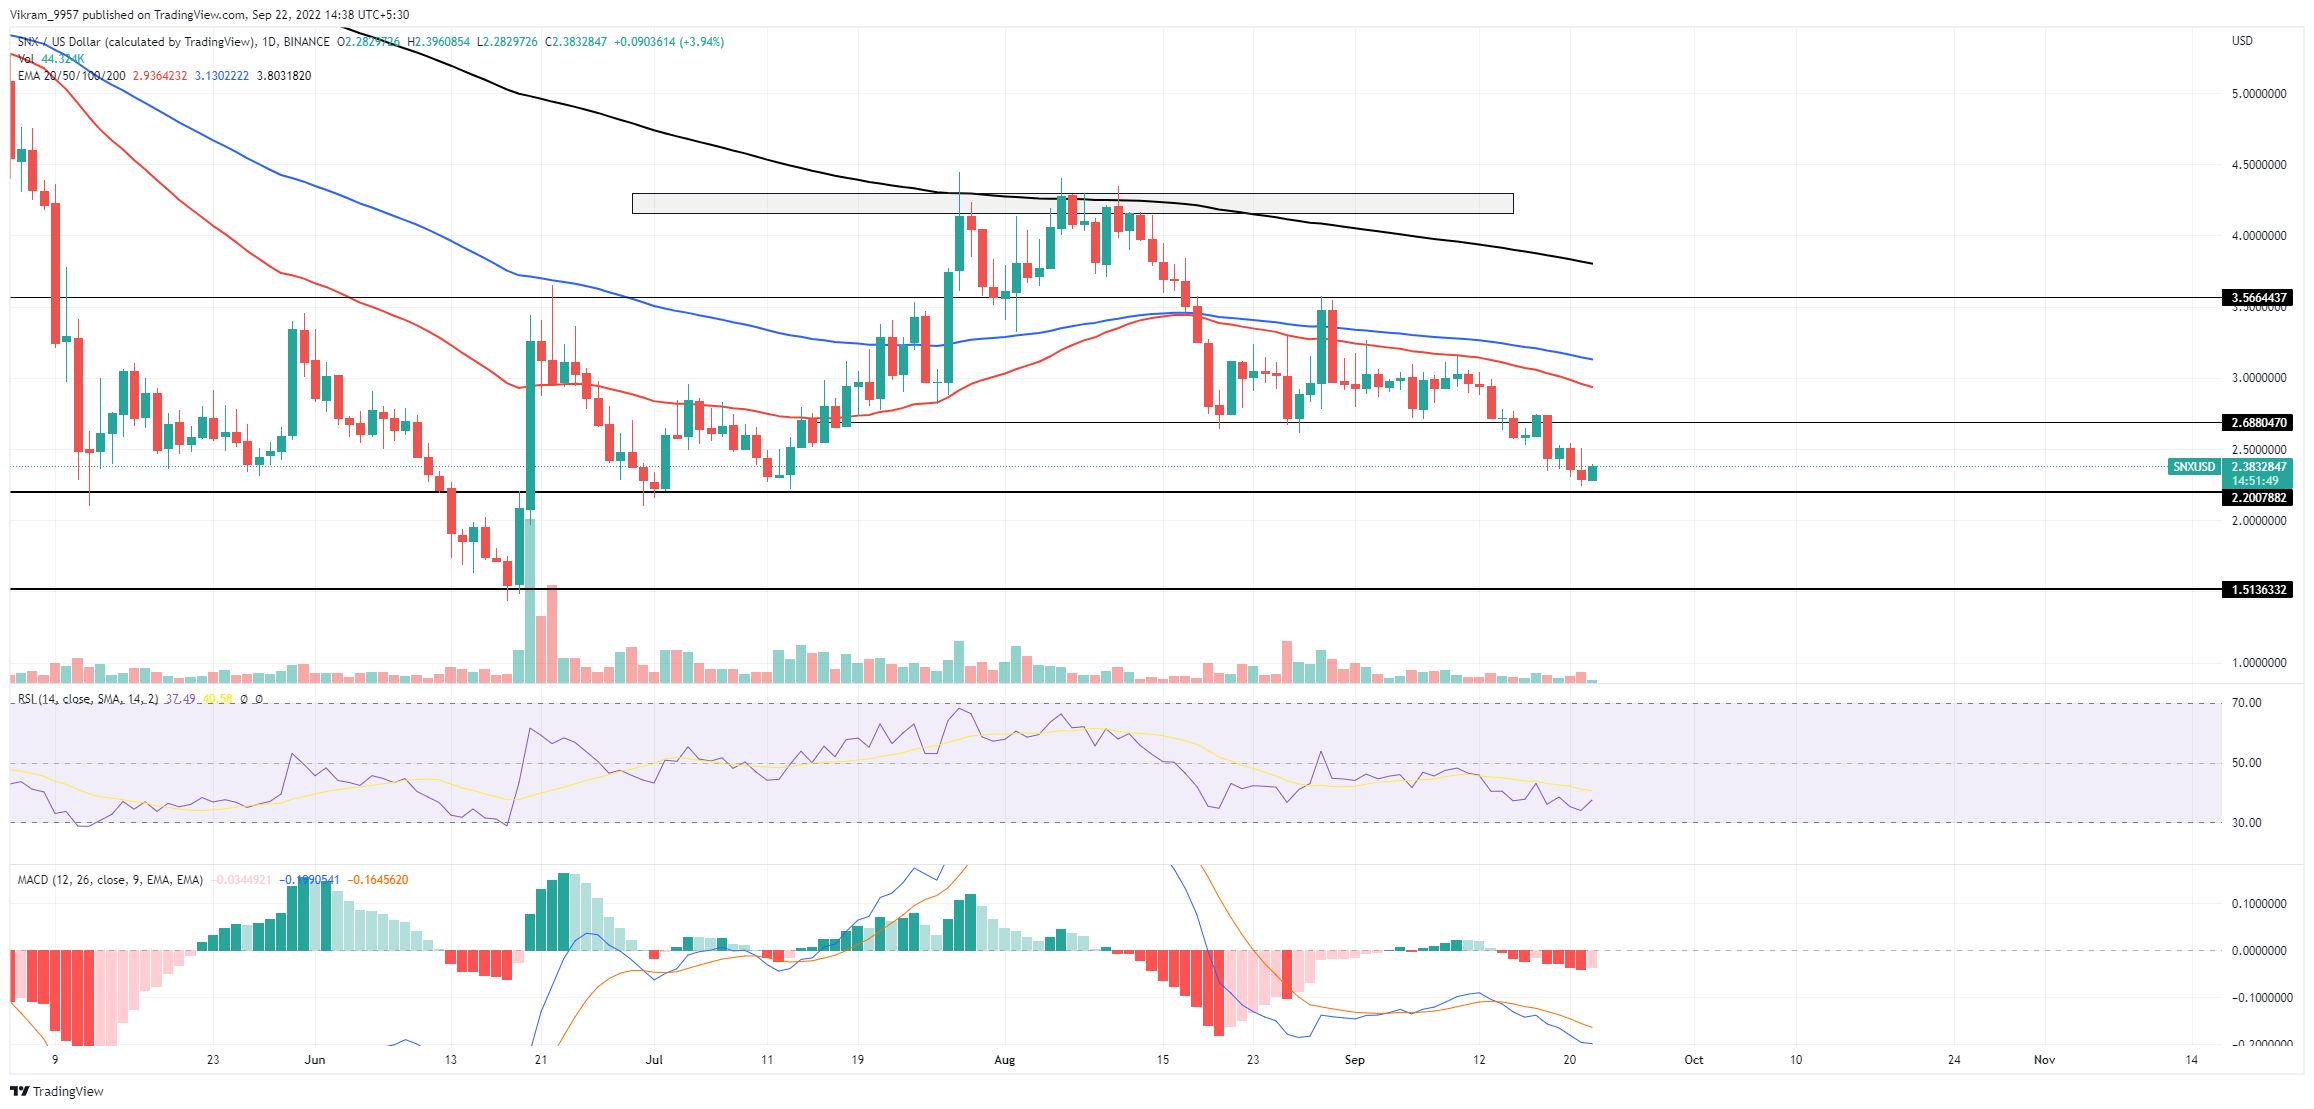 Source - TradingView
SNX Technical Analysis
The SNX price displays the start of a long-term downtrend after facing opposition from the 200-day EMA. After reversing from $4.5, the declining market value takes support at $2.20, accounting for a 46% downfall. Currently, the price trend sustains above the $2.20 mark avoiding a drop to the 78.6% Fibonacci level slightly above $2. Additionally, the 3.96% intraday jump resulted in a bullish candle with the potential to reach the overhead resistance of $2.68. However, the lack of bullish support in the intraday trading volume questions the possibility of the trend sustaining above $2.20. Therefore, traders hoping to ride the reversal rally must wait for the candle closing to avoid any higher price rejection trap. If the buying pressure persists, the fresh bull cycle can cross the $2.68 resistance level to test the 50% Fibonacci level at the psychological mark of $3. However, if the buyers fail to assert dominance over the 78.6% Fibonacci level, the SNX market value may drop by 25% to test the $1.50 psychological level.
Technical Indicators
The falling trend RSI slope under the 14-day SMA in the nearly oversold zone reflects a slight bullish reversal indicating a bullish revolt. Despite the enormous bearish gap, the turnaround in the MACD line teases a bullish crossover possibility with the signal line. Resistance Levels - $2.68 and $3 Support Levels - $2.2 and $2