The ATOM technical analysis shows the buyers reclaiming dominance over the 200-day EMA and the $15 mark. But will the uptrend sustain this month? The ATOM price action bullish reversal rally from a long-coming support trendline in the daily chart resulting in a price jump above the 200-day EMA. Furthermore, the rise in intraday trading volume supports the bull cycle, projecting a potential trend continuation to $20. However, the increased selling pressure above the EMA warns of a downfall.
Key Points:
- The Cosmos prices show higher price rejection above the 200-day EMA.
- The market value sustains above the $15 mark for now.
- The intraday trading volume in Cosmos is $616 Million.
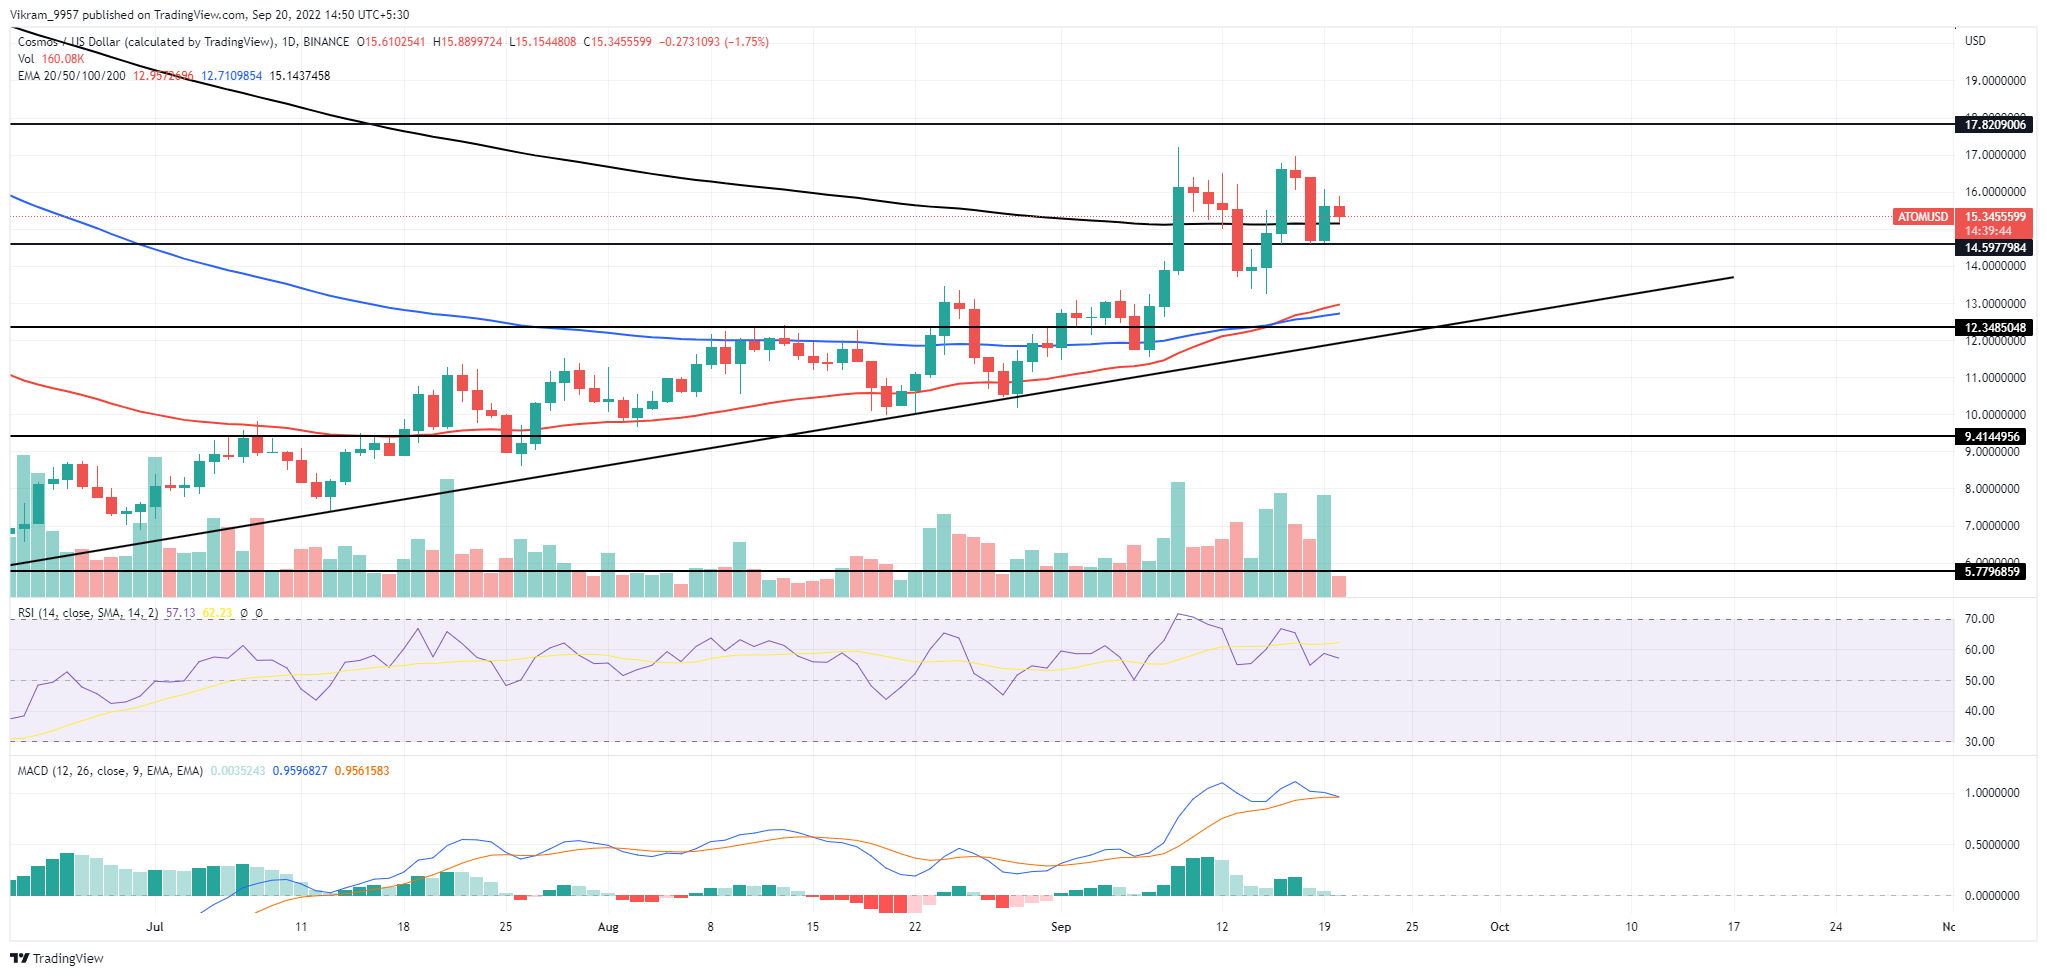 Source-Tradingview
ATOM Technical Analysis
The ATOM price displays a bullish reversal from the crucial daily support trendline resulting in a 48% jump over the past three weeks. The bullish rally beats the 50-day EMA and influences a crossover between the 50 and 100-day EMAs to regain positive alignment. However, the price faced increased selling pressure above the $15 mark resulting in a retracement to $14.5 twice this fortnight. Currently, the prices display a bullish attempt to sustain above the 200-day EMA and the $15 mark. With sustained selling, the ATOM price will tumble 13.2% and retest the neckline support of the double bottom pattern. A bearish breakdown from this support will accelerate the bearish momentum and offer a breakdown attempt from the long-coming support. However, until the ATOM price sustains above the rising trendline, the market participants can maintain a bullish outlook.
Technical Indicator
A bearish divergence in daily RSI slope bolsters the formation of a double bottom pattern, and its crossover below the mean line will encourage prolonged correction. Moreover, the bearish crossover between the MACD and signal lines signals a selling opportunity. Therefore, the technical indicators display a rising bearish sentiment. As a result, the ATOM technical analysis provides a selling opportunity. Resistance levels- $0.42 and $0.50 Support levels- $0.36 and $0.30