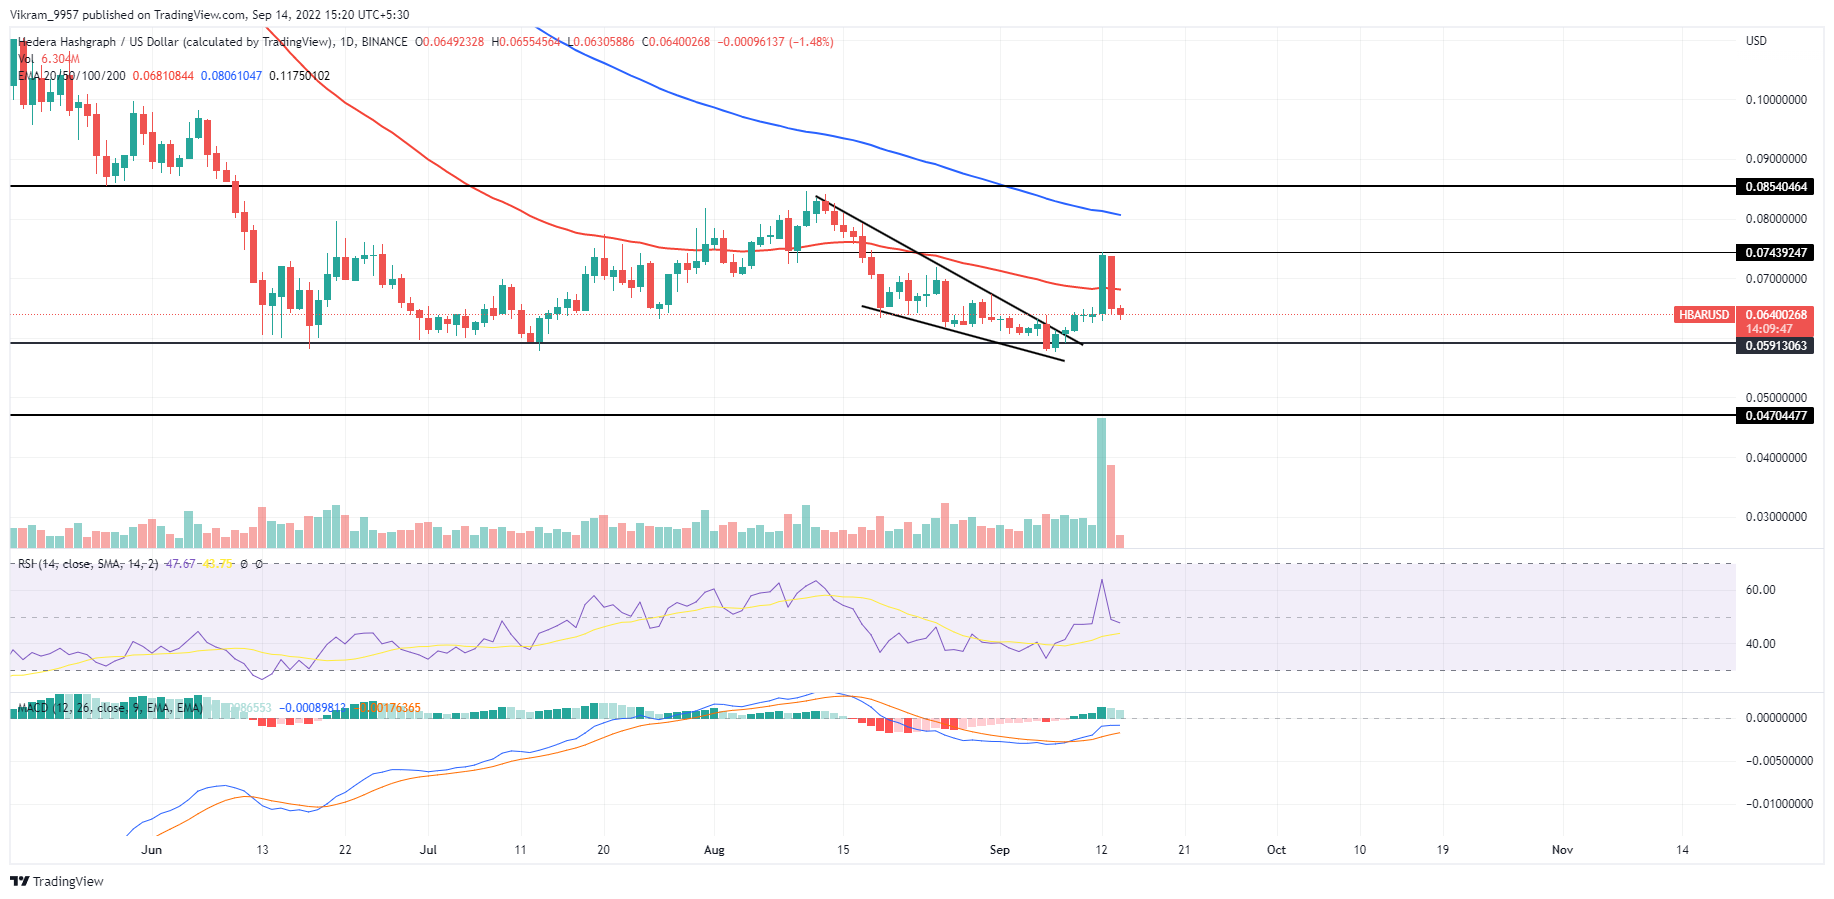
The HBAR price chart shows a 12% bearish engulfing candle sabotaging the wedge breakout rally and warns of a $0.059 breakout. The Hedera (HBAR) tested the $0.075 ceiling with an increase in volume spike. However, a sharp increase in selling pressure brings the market value down below $0.065, teasing a drop to the crucial support level of $0.059. So, should you consider avoiding the buying opportunity at the $0.059 mark?
Key Points:
- The Hedera price action shows a failed bullish breakout of a wedge pattern.
- The falling prices break under the 50-day EMA teasing a prolonged correction.
- The intraday trading volume in Hedera is $84.56 million.
 Source - TradingView
HBAR Technical Analysis
The Hedera price was pushed to its June-July bottom support level of $0.058 by the most retracement in the cryptocurrency market. However, the technical indicators showed the development of a falling wedge pattern in the daily time frame chart when the prices drew near to this lower support. So, with a substantial increase in volume activity on September 9th, the Hedera price provided a tremendous breakthrough from the patterns' resistance trendline. However, the coin price has returned with a bearish engulfing candle and is under supply pressure near the psychological threshold of $0.075. Furthermore, the HBAR prices have dropped below $0.065, teasing a drop to $0.059. Moreover, the increased selling projects potentially fall to the $0.050 mark. On the other hand, a bullish reversal from $0.059 can push the prices back to $0.075.
Technical Indicators
The RSI slowly drops below the halfway line due to increased sales forecasting and a downtrend continuation. Additionally, as the bullish histograms decline, the MACD indicator teases a bearish crossover between the fast and slow lines. Therefore, the technical indicators reflect the growing bearishness in the HBAR price chart. Resistance Levels - $0.075 and $0.090 Support Levels - $0.059 and $0.050
 cryptoknowmics.com