Litecoin [LTC] failed to gain significant momentum and continued to tread below $60 this week. The coin, however, recently surpassed EOS to consolidate its position as the fourth largest coin on CoinMarketCap. Litecoin [LTC] was locked in the price ceiling between $55-$59, after going through minor losses earlier this week.
On 14 March, the price of LTC opened at $55.94, gradually rising to $56.32, at press time. LTC held a market cap of $3.48 billion, with a 24-hour trading volume of $1.49 billion. The token registered a slight decline of 1.05% against the US Dollar.
Coineal contributed to 9.42% of the coin’s 24-hour trading volume via the trading pair LTC/BTC.
1-hour
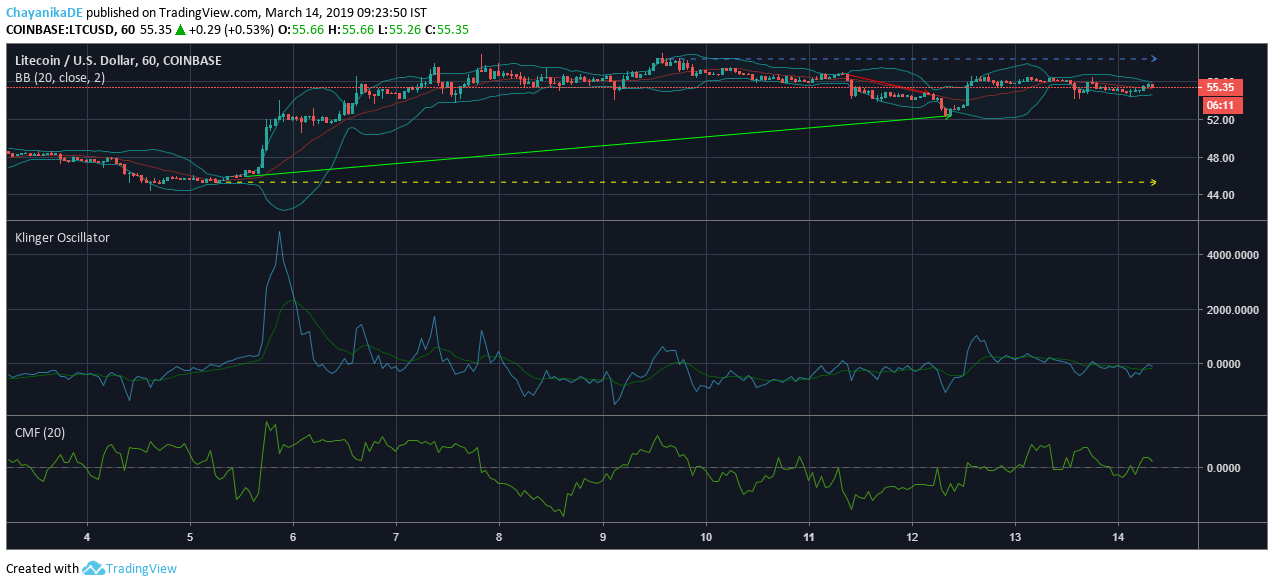
Source: TradingView
The hourly chart of the coin exhibited an uptrend from $45.94 to $52.42 and a minor downtrend from $56.76 to $54.82. The resistance for the coin remained at $58.40, while the support for the coin stood firmly at $45.36.
Bollinger Bands: The converging mouth of the bands indicated low volatility in the price movement of the coin.
Klinger Oscillator: Post a bullish crossover, the reading line was above the signal line.
Chaikin Money Flow: The CMF was above the zero-line, suggesting that money was flowing into the coin market. Therefore, a bullish price trend was predicted for LTC.
1-day
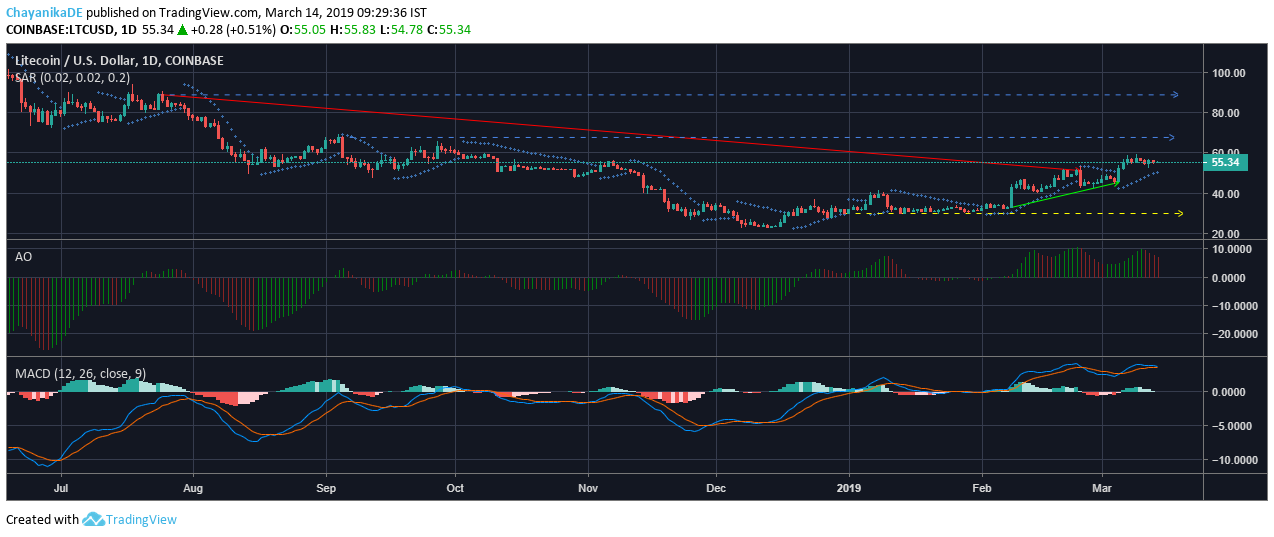
Source: TradingView
The candlesticks on the one-day LTC chart exhibited an uptrend from $32.81 to $45.40, and a major downtrend from $88.79 to $51.59. The immediate resistance for the silver crypto asset was noted at $89.15, while the significant support was found at $29.92.
Parabolic SAR: The dotted lines were aligned below the candles and indicated a bullish phase for the coin.
Awesome Oscillator: The closing bars of the indicator were red and suggested a bearish price momentum for Litecoin [LTC].
MACD: After treading above the signal line, the MACD indicator sustained a bearish crossover. This suggested that LTC’s price was siding with the bear.
Conclusion
The short-term indicators pictured the coin following a bullish course with low volatility, while the long-term indicators suggested a dominant bearish market phase for LTC.