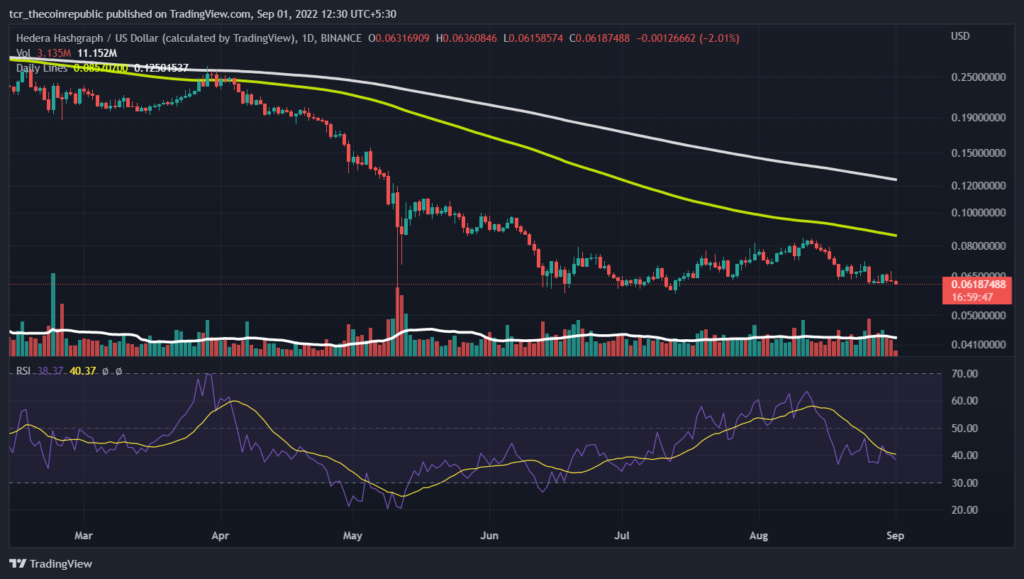
- Hedera coin price is currently consolidating below its support level. The asset price is trading near $0.0612
- Technical indicators of Hedera suggests a downward trend in price. Meanwhile,HBAR/BTC pair is down by 3.7% in the intraday session.
Hedera is one of the most used decentralized networks for individuals and business to create powerful applications. It is designed to be fairer and efficient system which eliminates some of the limitations of the older blockchain. The asset was funded through initial coin offering in 2018 and the mainent was launched in september 2019.The asset has a market dominance of 0.13% and is ranked 40th in the crypto verse.
The asset has a market cap of $1,309,657,426 and has supply of 50 Billion.The volume of the asset price has seen a decline of 16% in the intraday session. The volume to market cap ratio of the asset suggests a consolidated move.
Technical Indicators Of The HBAR Are Favoring The Bears

The weekly technical chart of the Hedera suggests a consolidated trend in price. On coming to the daily chart, the asset price is near $0.06214. The support of the asset price can be observed near $0.05. The asset price is currently trading below the 50 and 100 Daily Moving Average. The resistance of the coin can be seen near $0.09.
RSI: RSI of the asset price is currently near 39 highlighting its presence in the oversold zone. There is a negative slope in the RSI suggesting a downside trend. The overall sentiment of the RSI is bearish.
Conclusion
Hedera coin price is currently observing a consolidated trend and can move to a new high. One should do their due diligence before investing.
Technical Levels
Major Resistance:$0.095-$0.1
Major Support: $0.045-$0.05
Disclaimer
The views and opinions stated by the author, or any people named in this article, are for informational ideas only, and they do not establish the financial, investment, or other advice. Investing in or trading crypto assets comes with a risk of financial loss.
 thecoinrepublic.com