Be[in]Crypto takes a look at the five cryptocurrencies that increased the most last week, more specifically, from Aug 26 to Sept 2.
These cryptocurrencies are:
- Celsius (CEL): 30.11%
- eCash (XEC): 18.04%
- Polygon (MATIC): 9.74%
- Nexo (NEXO): 8.31%
- Lido DAO (LDO): 5.38%
CEL
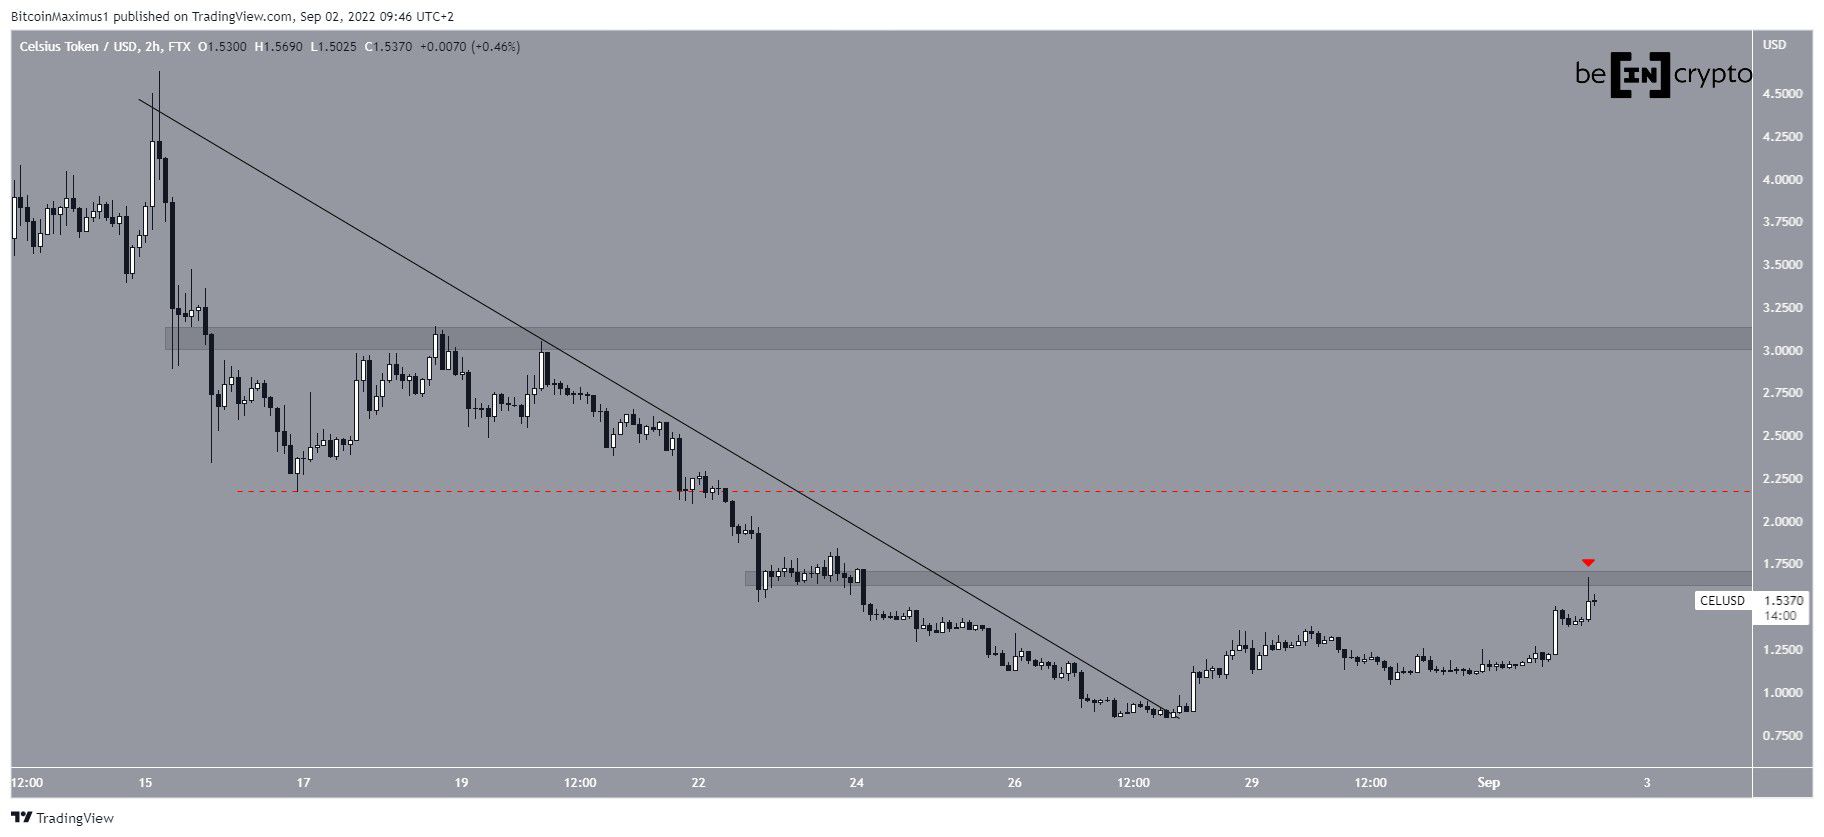
On Aug 28, CEL broke out from a descending resistance line that had been in place since Aug 15. It began an upward movement afterwards and has so far reached a high of $1.67 on Sept 2, before it was rejected by the $1.65 resistance area (red icon).
It is not yet certain if the downward movement is corrective or if it is the beginning of a new impulse. An increase above the $2.16 lows (red line) would confirm that the decrease was corrective and that CEL has now begun a new upward movement. In that case, the next closest resistance would be at $3.
XEC
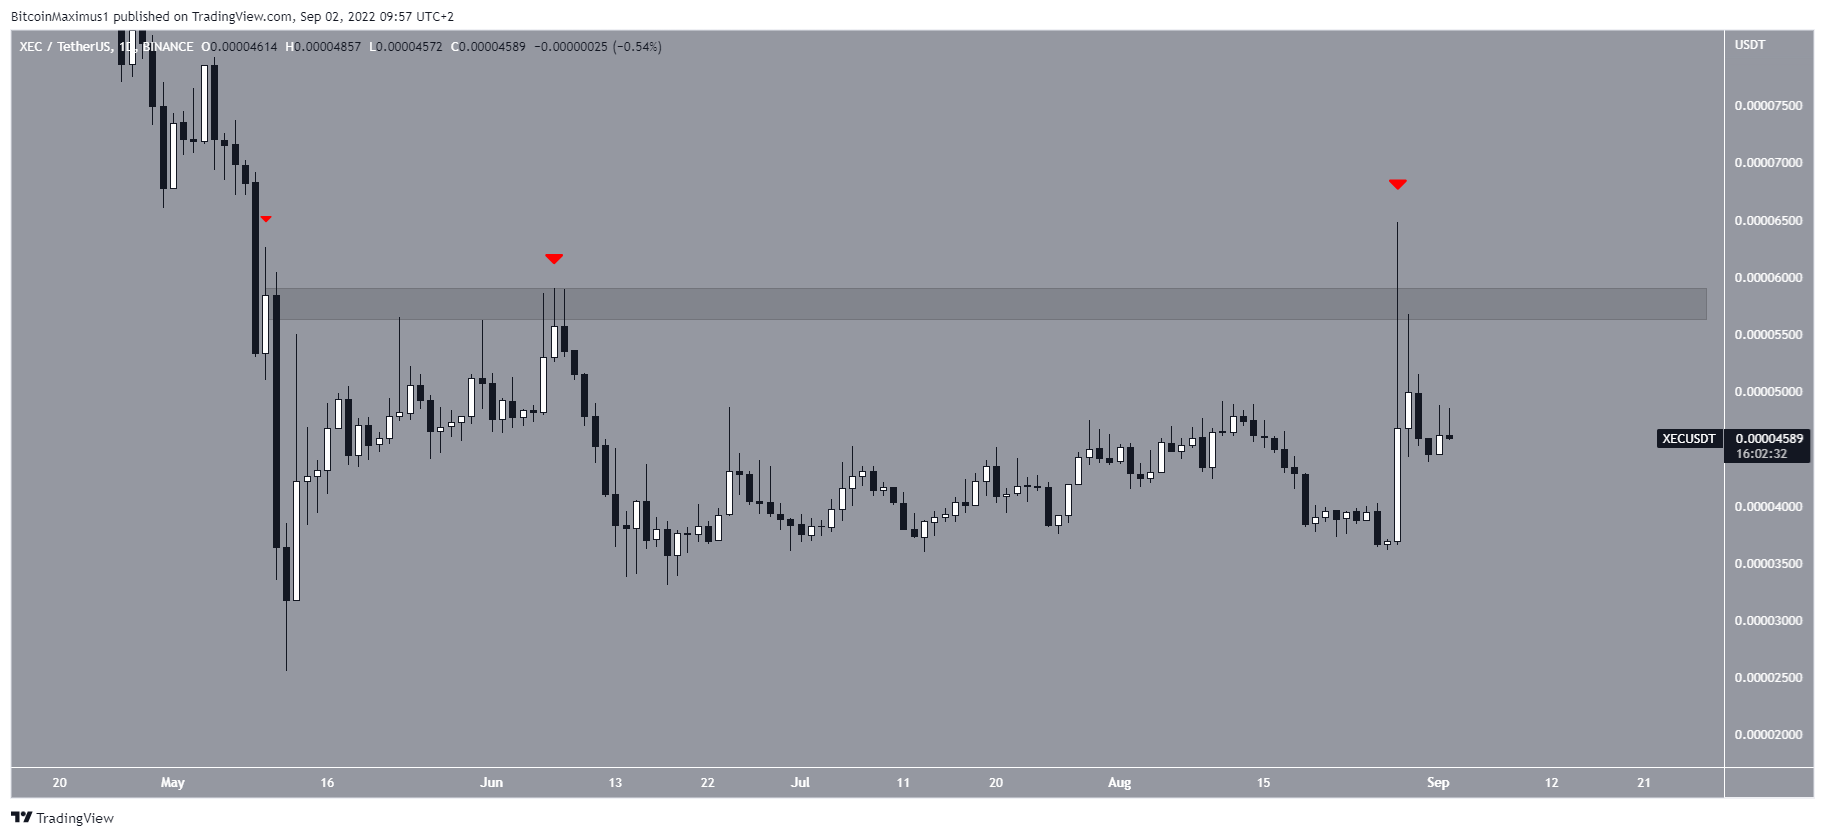
XEC has been moving upward since May 12. Since then, it has made three attempts at moving above the $0.000057 resistance area (red icons), all of which have been unsuccessful.
Since resistances get weaker each time they are touched, an eventual breakout from this resistance would be the most likely scenario.
MATIC
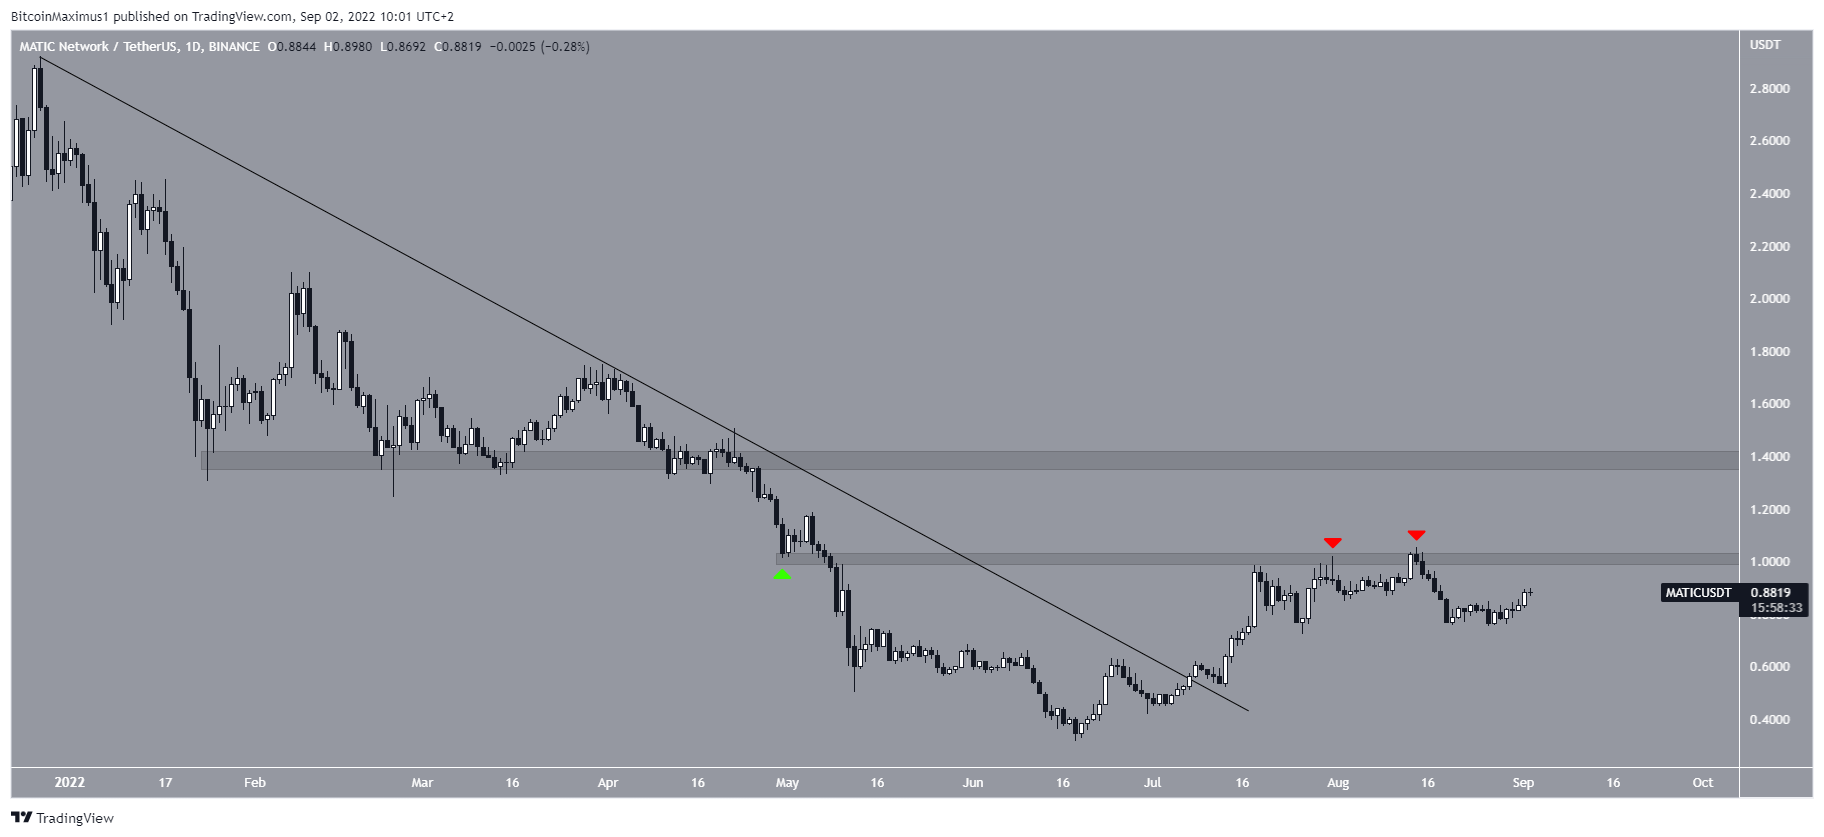
MATIC has been decreasing underneath a descending resistance line since the beginning of the year. The downward movement led to a low of $0.31 on June 18.
The price has been moving upward since and broke out from the line on July 8.
Since then, it has made two attempts at breaking out from the $1.05 resistance area (red icons), both of which have been unsuccessful.
A breakout above this level would likely take MATIC towards the next resistance at $1.40.
NEXO
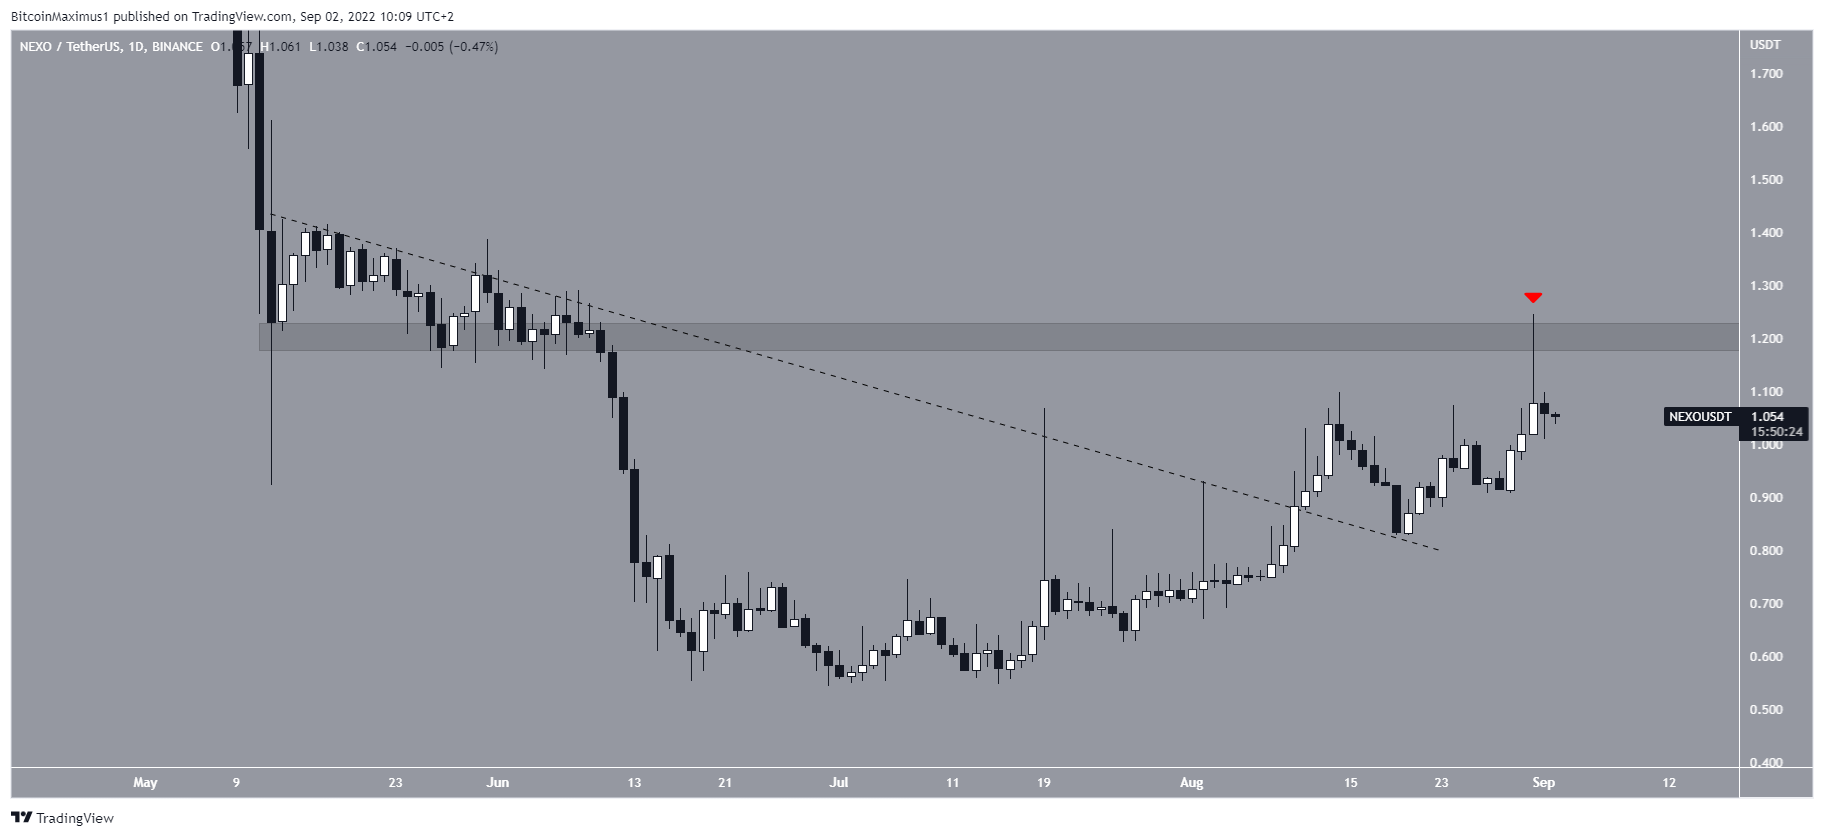
NEXO has been moving upwards since June 30. On Aug 11, it managed to break out from a descending resistance line. After validating the line as support five days later, the price accelerated its rate of increase and made an unsuccessful attempt at moving above the $1.20 horizontal resistance area.
Due to the lack of overhead resistance, a decisive movement above this area would be expected to accelerate the rate of increase.
LDO
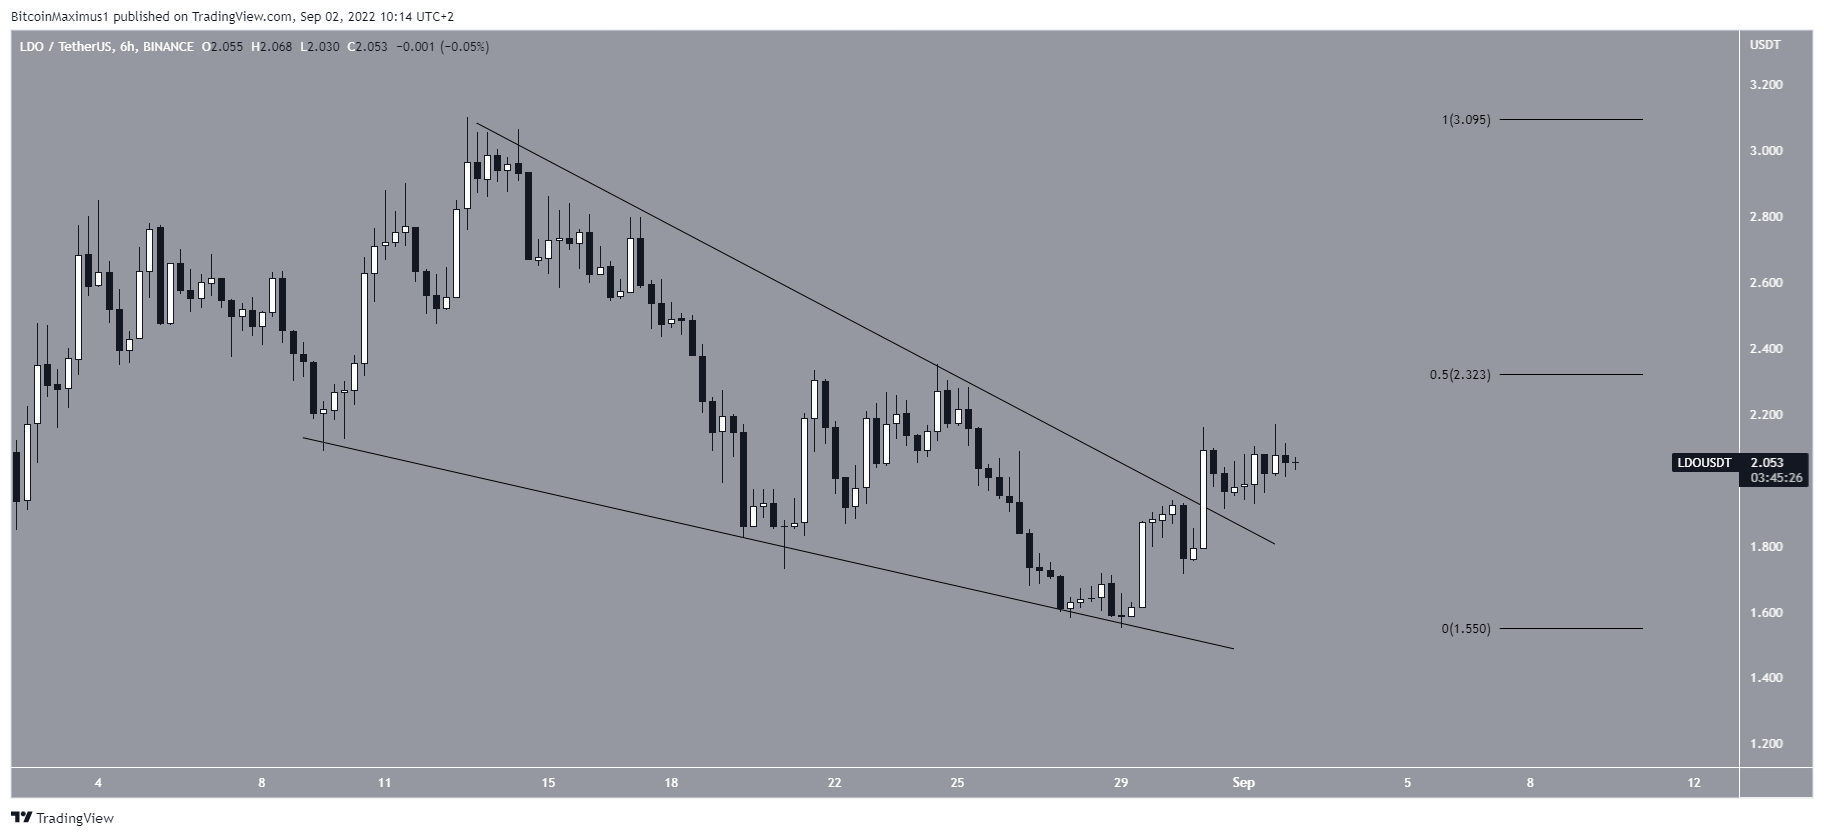
LDO had been decreasing inside a descending wedge since Aug 8. The wedge is considered a bullish pattern, meaning that a breakout from it would be the most likely scenario.
LDO managed to break out on Aug 31 but has yet to initiate a significant upward movement. If it does, the main resistance area would be at $2.32, created by the 0.5 Fib retracement resistance level and a horizontal resistance area.
For Be[in]Crypto’s previous Bitcoin (BTC) analysis, click here
 beincrypto.com