The cryptocurrency market and its erratic behavior put a lot of investors and users on the edge of their seats as coin prices and market cap both failed to beat the bear market. Popular coins like Bitcoin [BTC], Ethereum [ETH] and Tron [TRX] witnessed sideways price movement, despite updates and developments in the field.
1 hour
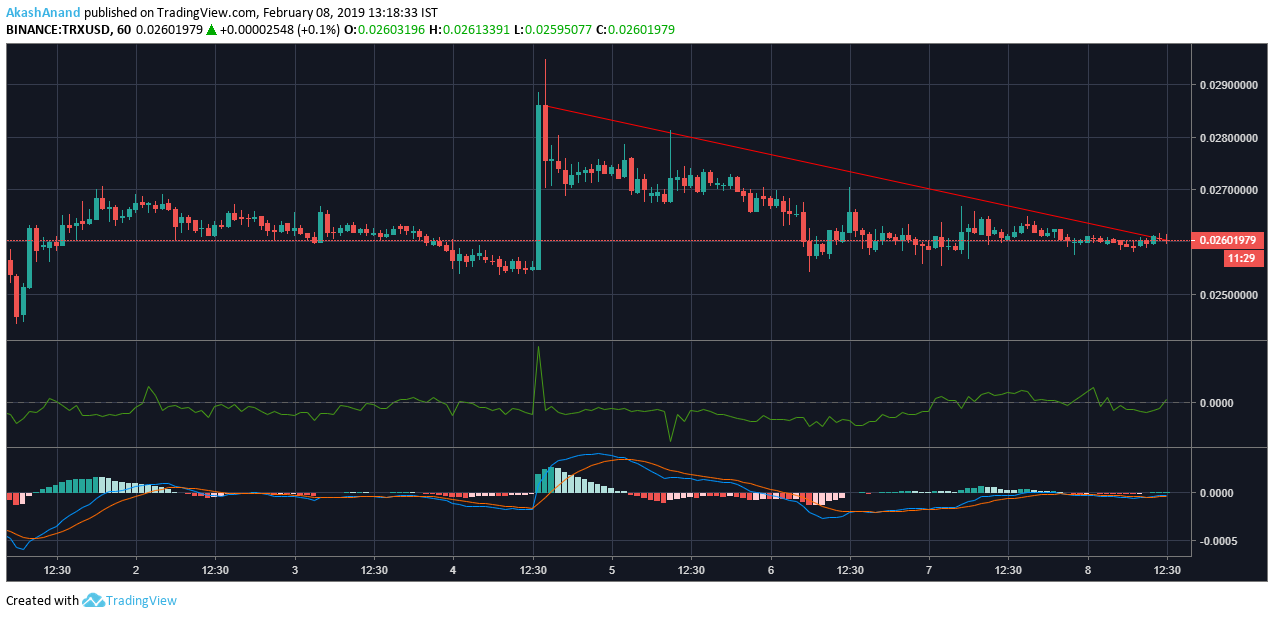
Source: TradingView
Tron’s one-hour graph showed a downtrend caused by the market’s continued sideways movement. The downtrend resulted in the price falling from $0.024 to $0.023. The support was at $0.021 while the resistance was holding at $0.024.
The Parabolic SAR was above the price candles, a clear bearish sign. The SAR displayed a mix of both bearish and bullish signals in the long run.
The Awesome Oscillator indicated a lull in market momentum as the amplitude of the graph was stalling.
The Chaikin Money Flow indicator on the zero line, meaning there was an equilibrium between the capital coming into the market and the capital leaving the market.
1 day
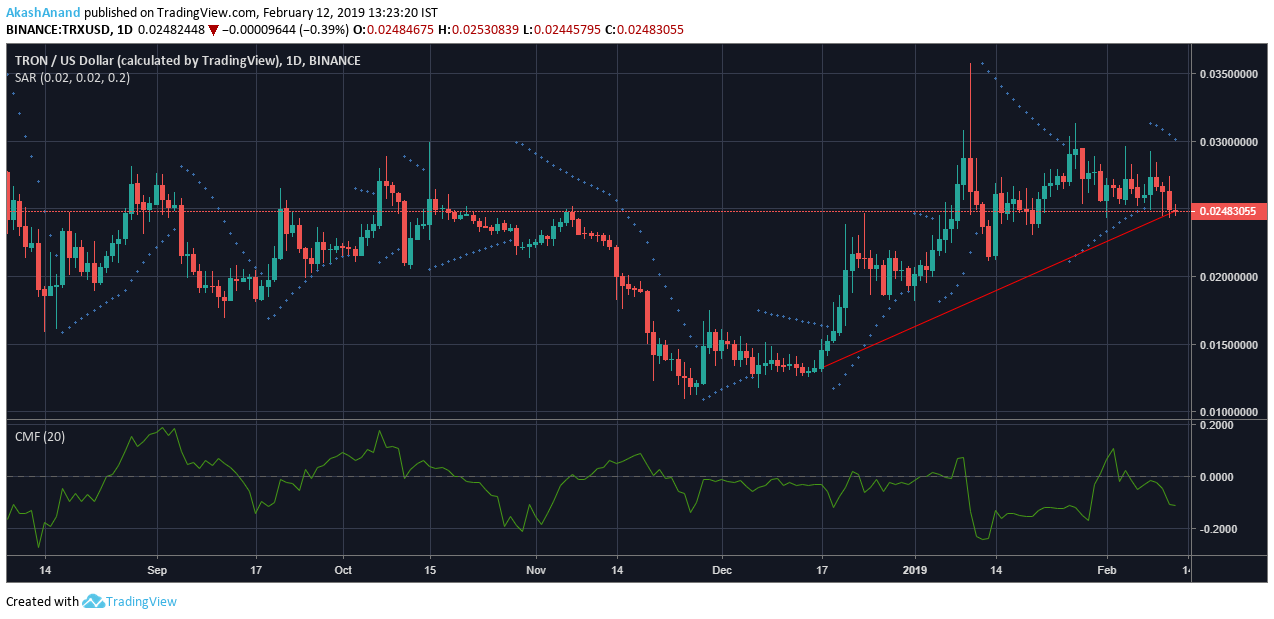
Source: TradingView
The one-day chart for Tron showed a picture that was opposite to the one-hour chart. The uptrend lifted the price from $0.013 to $0.022, while the long term support was found at $0.0126.
The Bollinger bands showed a slight divergence as the price breakout was in the bear’s favor.
The Relative Strength Index crashed towards the oversold zone, as the selling pressure was much higher than the buying pressure in the market.
The MACD indicator was below the histogram after the signal line and the MACD line underwent a bearish crossover. The MACD histogram was almost zero which reflected the sideways movement of the market.
Conclusion
Both the one-hour and one-day charts suggested that Tron will continue to stay in the bear’s territory, a stay marked by sporadic bull rises.