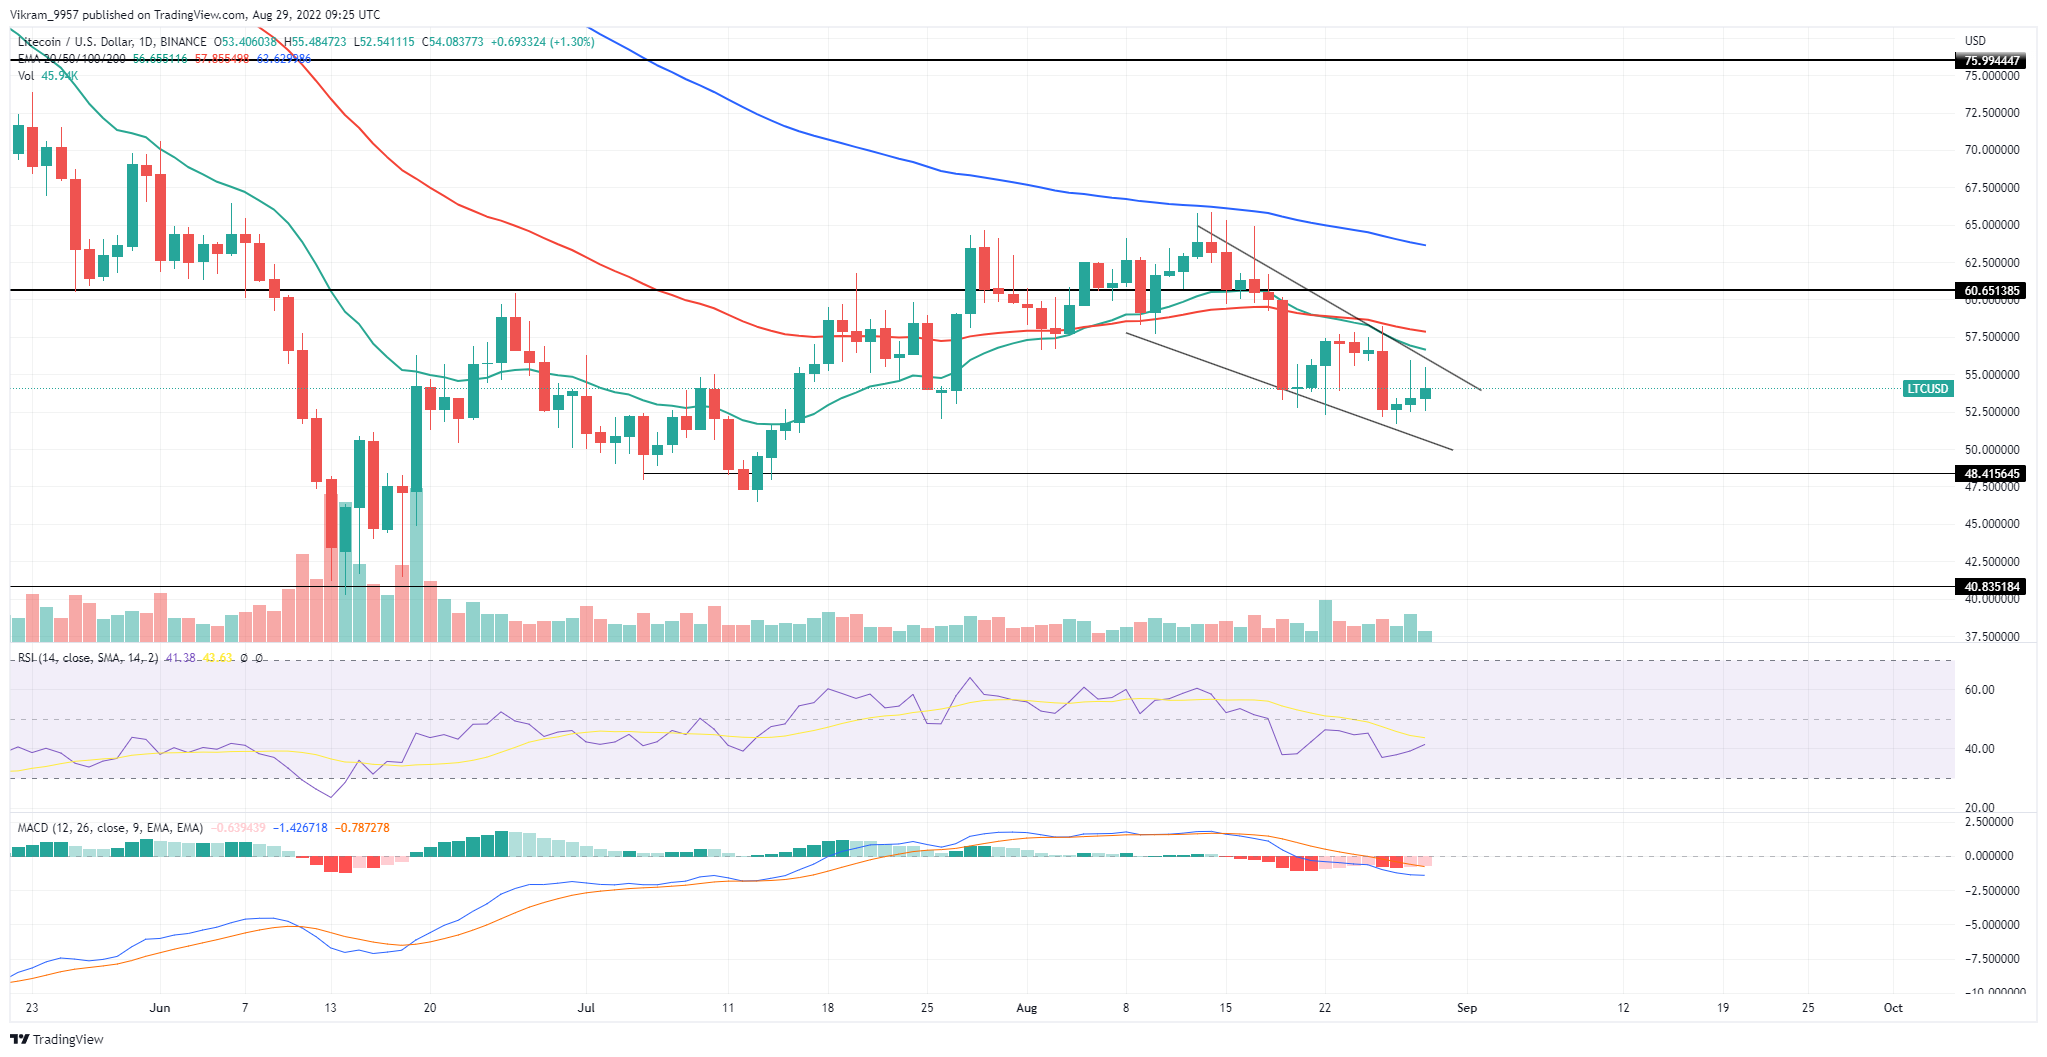
A morning star candle formation at the $52.2 support indicates the buyers are attempting price recovery. However, no significant jump in volume activity yet means a better confirmation is needed. Will LTC bulls wrestle trend control from sellers at this support zone, or there’s more in the correction rally? Key Points:
- The LTC price action displays a bearish candle showing a downtrend continuing below $5.
- The MACD indicator shows a downtrend in the fast and slow lines.
- With a market cap of $3.83 Billion, the intraday trading volume of Litecoin has increased by 58% to reach $544 million.
 LTC/USD Chart"> Source- TradingView
LTC Technical Analysis
On August 18th, the LTC prices broke below the support trendline to continue the prevailing downtrend. Therefore, this breakdown should have positioned the price trend to revisit the $48.5. The falling prices maintain our bearish wedge pattern in the daily chart, with higher price rejection candles reflecting an increase in selling pressure. As a result, the prices revert from the resistance trendline, projecting a potential downfall in the coming days. Moreover, the supply pressure from the 50-day SMA reflects an increased possibility of a prolonged downtrend. Despite the general belief that the bearish veg pattern gives a bullish breakout, the litecoin prices may shortly dip below the support trend line. If the selling pressure grows, the LTC prices may shortly break below the psychological mark of $50 to test the $48.50 support level. Conversely, a bullish reversal breaking above the resistance trendline will retest the broken $60 horizontal level.
Technical Indicators
The RSI slope maintains a declining trend as it breaks below the halfway line. Furthermore, the MACD indicator displays the bearish gap between the fast and slow lines increasing as they cross below the zero line. Hence, the risk of LTC prices plummeting under the psychological mark of $50 increases drastically. Resistance Levels: $55 and $60 Support Levels: $50 and $48
 cryptoknowmics.com
