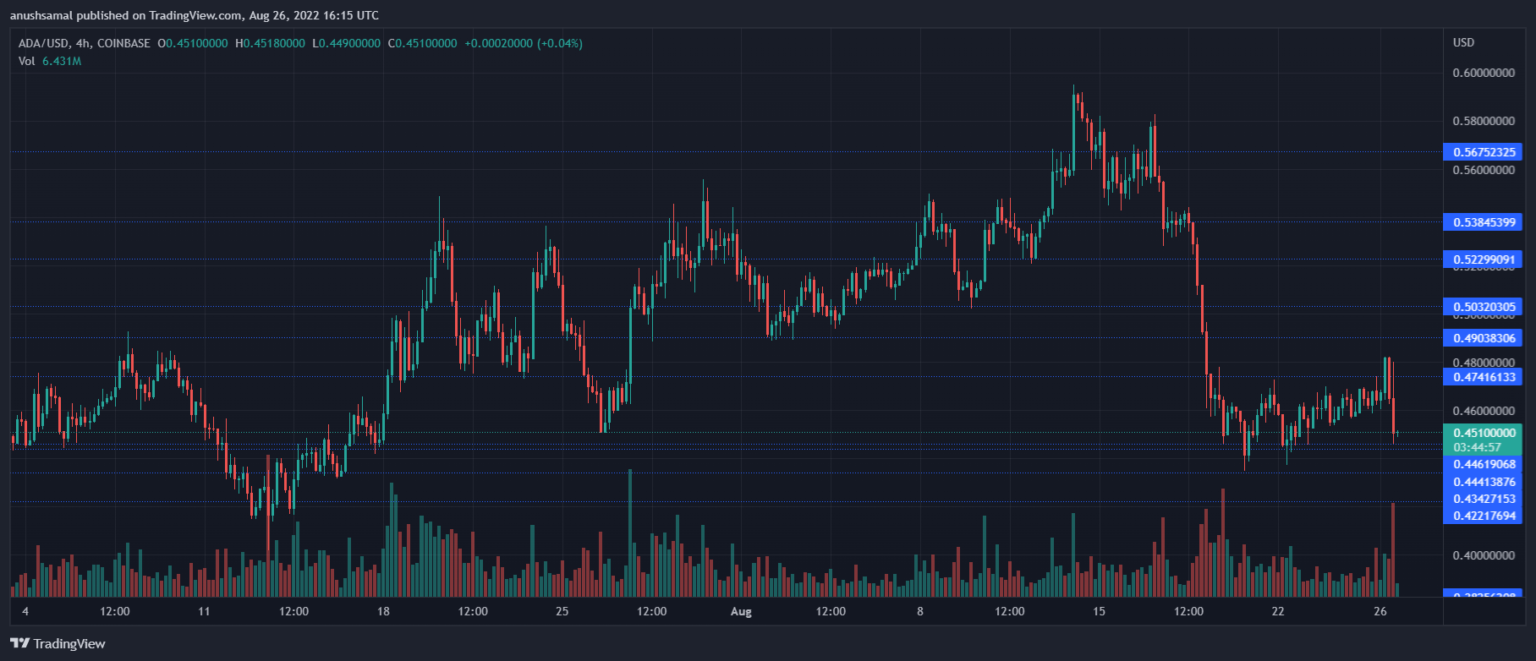
Cardano price registered bearishness as it declined from the $0.48 level at the time of writing. Over the last 24 hours, the coin fell by over 2%. In the past week, it declined by 12%. Bitcoin’s move to the $20,000 had led to other altcoins falling on their charts as well. ADA was managing to appreciate slowly however, the bulls could not sustain the price momentum at the time of writing.
The altcoin had managed to trade near the $0.48 price level but it was met with selling pressure as it could not move above the $0.49 resistance mark. The technical outlook for the coin shifted towards bearishness as soon as the coin touched the $0.44 price level.
The immediate support for ADA was at $0.43. Sellers had taken over the market at the time of writing. The coin recently broke below the support line of $0.44, it had managed to trade above that level for a significant period of time. Lack of demand has caused Cardano price to further lose value. The global cryptocurrency market cap today is $1.05 Trillion after a 4.4% negative change in the last 24 hours.
Cardano Price Analysis: Four-Hour Chart

ADA was trading for $0.44 at the time of writing. There has been a sharp decline in the price of the altcoin after it revisited the $0.48 level. The support level for the coin stood at $0.42 and a fall below that could cause ADA to trade at $0.38.
Overhead resistance for the coin stood at $0.49. If the buying strength resurfaces then a move above the $0.49 level could be expected. The next resistance mark would be at $0.52 for the altcoin. The trading volume of Cardano fell which indicated that sellers had taken over at the time of writing.

ADA depicted selling strength on the four-hour chart as the price of the altcoin registered reduction. The continued sideways movement caused buyers to leave the market.
The Relative Strength Index was below the half-line which meant that sellers had taken over the market at press time.
Cardano price was below the 20-SMA line signifying lower demand levels and that sellers were driving the price momentum in the market.

The altcoin started to picture a selling signal on the four-hour chart. The Moving Average Convergence Divergence points at the price momentum and reversal of the same. MACD underwent a bearish crossover and just displayed one red signal bar which was a sell signal for ADA.
This could also mean that ADA might lose value over the next trading sessions as well. Bollinger bands indicate price volatility and price fluctuations. Bollinger Bands were parallel and that meant price of ADA would trade around the same level over the immediate trading sessions.
 newsbtc.com