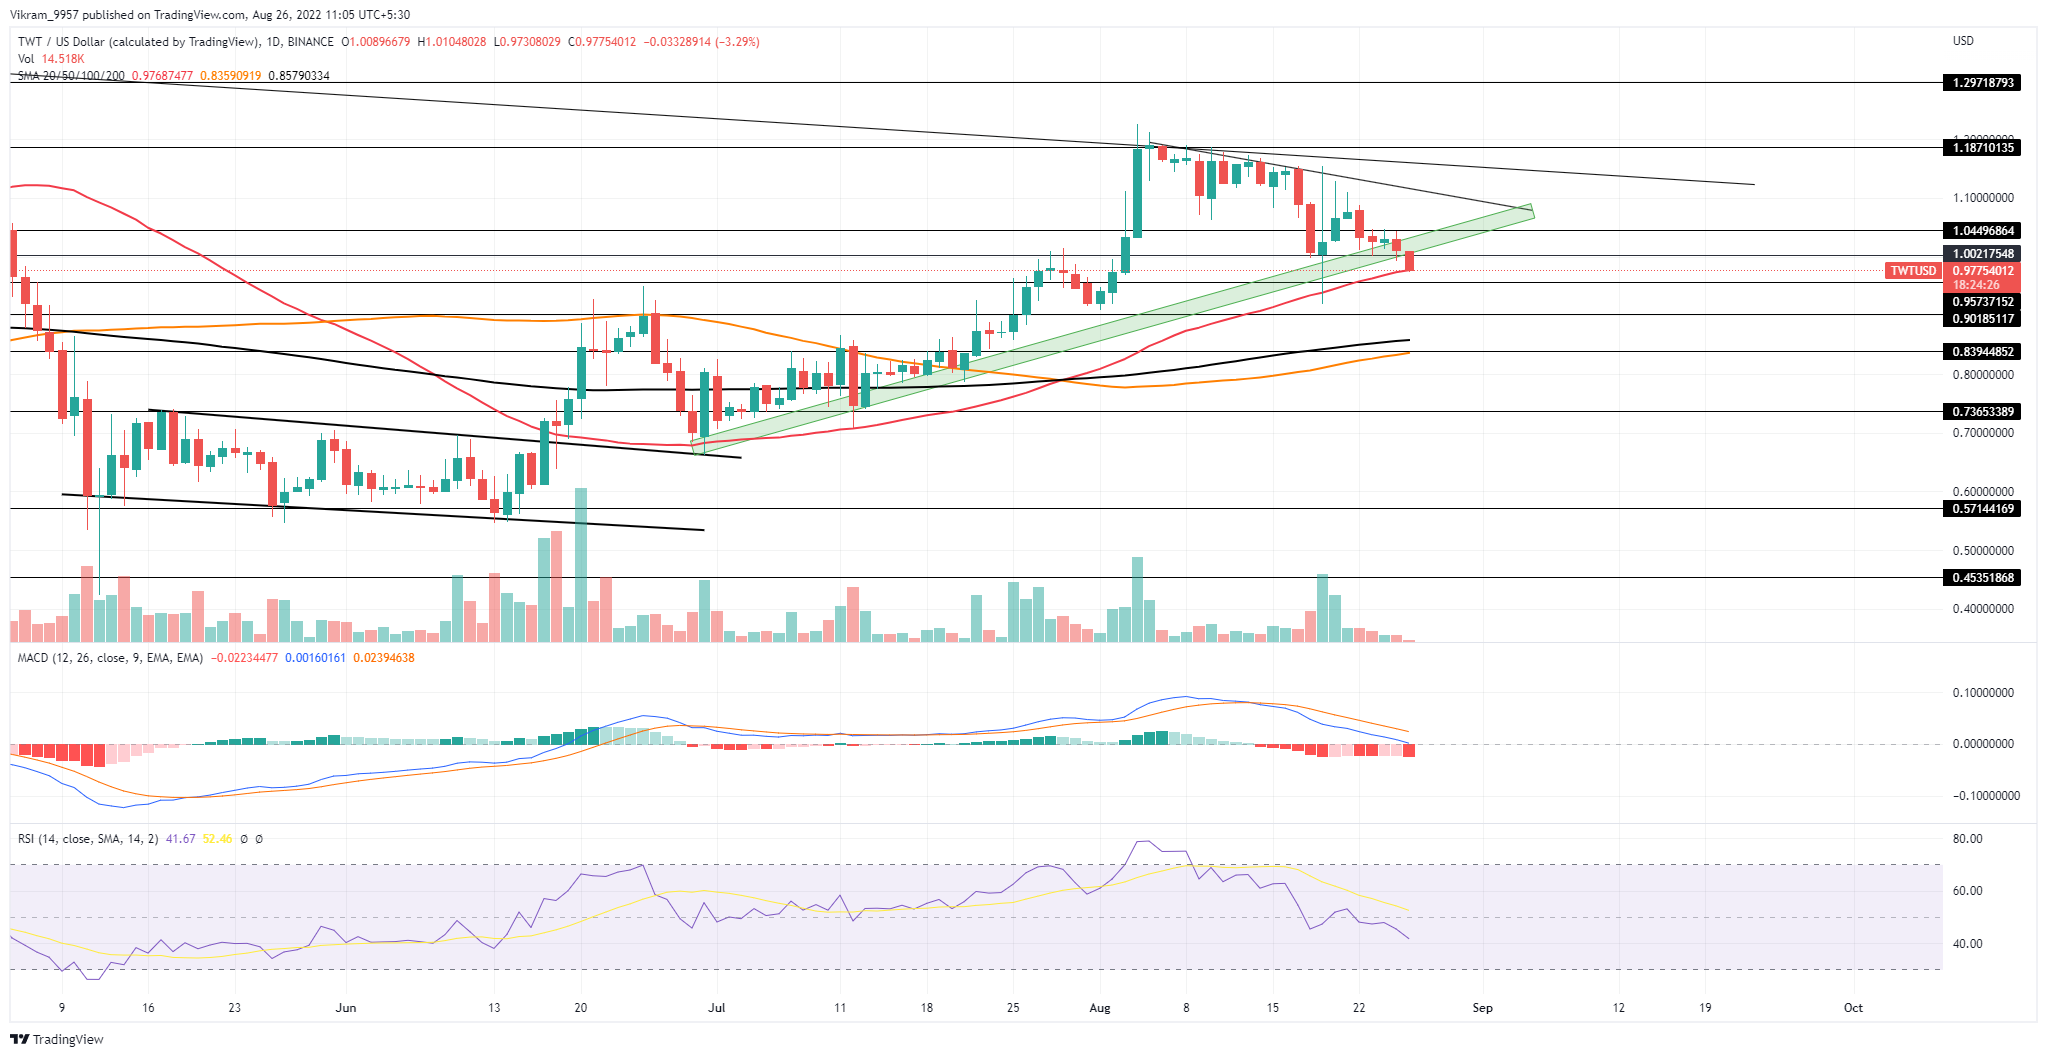
TWT technical analysis displays a bearish trend breaking below the demand zone and the psychological mark of $1. Will the downfall drive the prices below $0.95? After failing to sustain above the ascending support trendline, the TWT prices dropped by 17% within three weeks. Moreover, the correction phase breaks under the psychological mark of $1 and continues to test the 50-day SMA. So, will the SMA help the market value bounce back above $1, or a downtrend below $0.95 is inevitable?
Key Points:
- The TWT price trend is displaying a correction phase gaining momentum and testing the supporting 50-day SMA.
- The 50-day SMA breakout can result in a high momentum fall in market price to $0.90.
- With a market cap of $407 million, the intraday trading volume of Trust Wallet Token has increased by 36% to reach $13.9 million.
 TWT/USD Price Chart"> Source - Tradingview
TWT Technical Analysis
After a remarkable price jump of 30% within three days, the TWT prices took a bearish turnaround from the overhead resistance trendline near $1.20. The downtrend breaks below the psychological mark of $1.0 near the crucial demand zone accounting for a 17% price drop in the last three weeks. Currently, the daily candle shows a 3% price drop and tests the buyers at the 50-day SMA. Meanwhile, the crucial SMAs maintain a positive trend teasing a bullish crossover between 100 and 200-day SMA. However, the lack of any spike in the trading volume questions the credibility of the bearish trend. Nonetheless, as the demand zone is broken, the possibility of a 50-day SMA increases that may soon test the crucial support level of $0.90. Conversely, a bullish reversal leading to lower price rejection in the daily candle can help the buyers regain dominance over the psychological mark of $1.0.
Technical Indicators
The RSI slope falls sharply below the halfway line reflecting a sharp increase in the underlying bearishness. The fast and slow lines display an increasing gap while maintaining a declining trend, ready to cross the zero line. Hence the technical indicators support the downtrend possibility of TWT prices under the 50-day SMA. Resistance Levels: $1 and $1.10 Support Levels: $0.95 and $0.90
 cryptoknowmics.com
