Litecoin price analysis for today is bearish as the cryptocurrency has not been able to break out of the $55.23 resistance level. The bears are currently in control of the market and are looking to push prices lower. The next level of support for Litecoin is at $52.52. This is a key level to watch as a break below this could signal further downside for the cryptocurrency.
The Litecoin price is currently trading at $55.05 and is down 0.60% on the day. The cryptocurrency has a market cap of $3.32 billion and is ranked 7th in the market cap rankings. with the 24-hour trading volume at $1.92 billion. The Litecoin price is currently down 7.32% over the past 7 days and is down 3.47% over the past 30 days. However, the cryptocurrency shows potential for a reversal as the recent price analysis indicates the cost of LTC is moving upwards toward the resistance.
LTC/USD 4-hour price analysis: Recent developments
The 4-hour, Litecoin price analysis seems to show the market following a positive movement with the market’s volatility entering a declining movement, consequently closing the market. This makes the cryptocurrency price less prone to experience volatile change on either extreme.
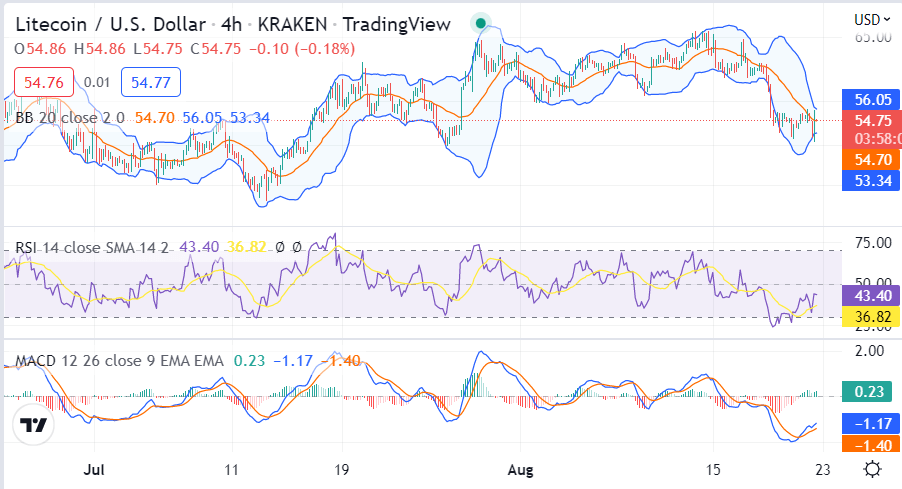
As a result, the Bollinger’s band upper limit is present at $55.94, representing the strongest resistance for LTC. Conversely, the lower limit of the Bollinger’s band is present at $52.52, expressing the strongest support for the meme cryptocurrency. The MACD indicator is showing bearish signs as the signal line is above the MACD line, and both are sloping downwards. The RSI indicator is also leaning towards the oversold zone with a value of 46.23.
Litecoin price analysis on a daily chart: Prices seek support at $52.52
Litecoin price analysis indicates the prices have been trading between a range of $52.52 and $55.94 over the last 24 hours, with the cryptocurrency failing to break out of the resistance at $55.94. The market is currently in a bearish trend as the prices are below the moving averages.
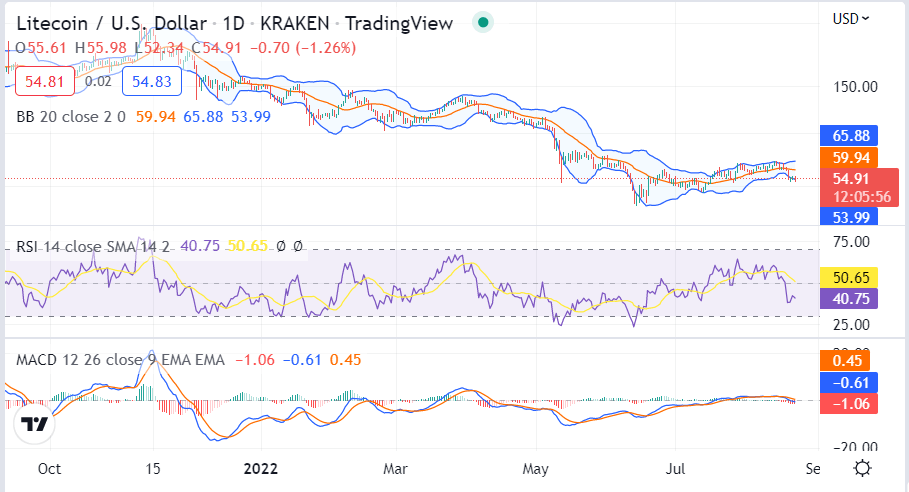
The Bollinger bands are both moving towards each other, which is a sign of decreasing market volatility. The MACD line is at risk of crossing below the signal line, which is a bearish sign. The RSI indicator is currently at 46.23 and is in the oversold region. The Litecoin price will need to break out of the $55.94 resistance level to resume its uptrend.
Litecoin Price Analysis Conclusion
Litecoin price analysis reveals the cryptocurrency following a shaky bearish movement, showing massive bullish potential. The market shows colossal potential for a reversal in the coming days. If the bulls manage to use it to their advantage, they might engulf the market and help raise the price of Litecoin beyond expectations.
Disclaimer. The information provided is not trading advice. Cryptopolitan.com holds no liability for any investments made based on the information provided on this page. We strongly recommend independent research and/or consultation with a qualified professional before making any investment decisions.