Uniswap (UNI) has been moving downward since reaching a high of July 28, but has potentially completed a short-term corrective structure.
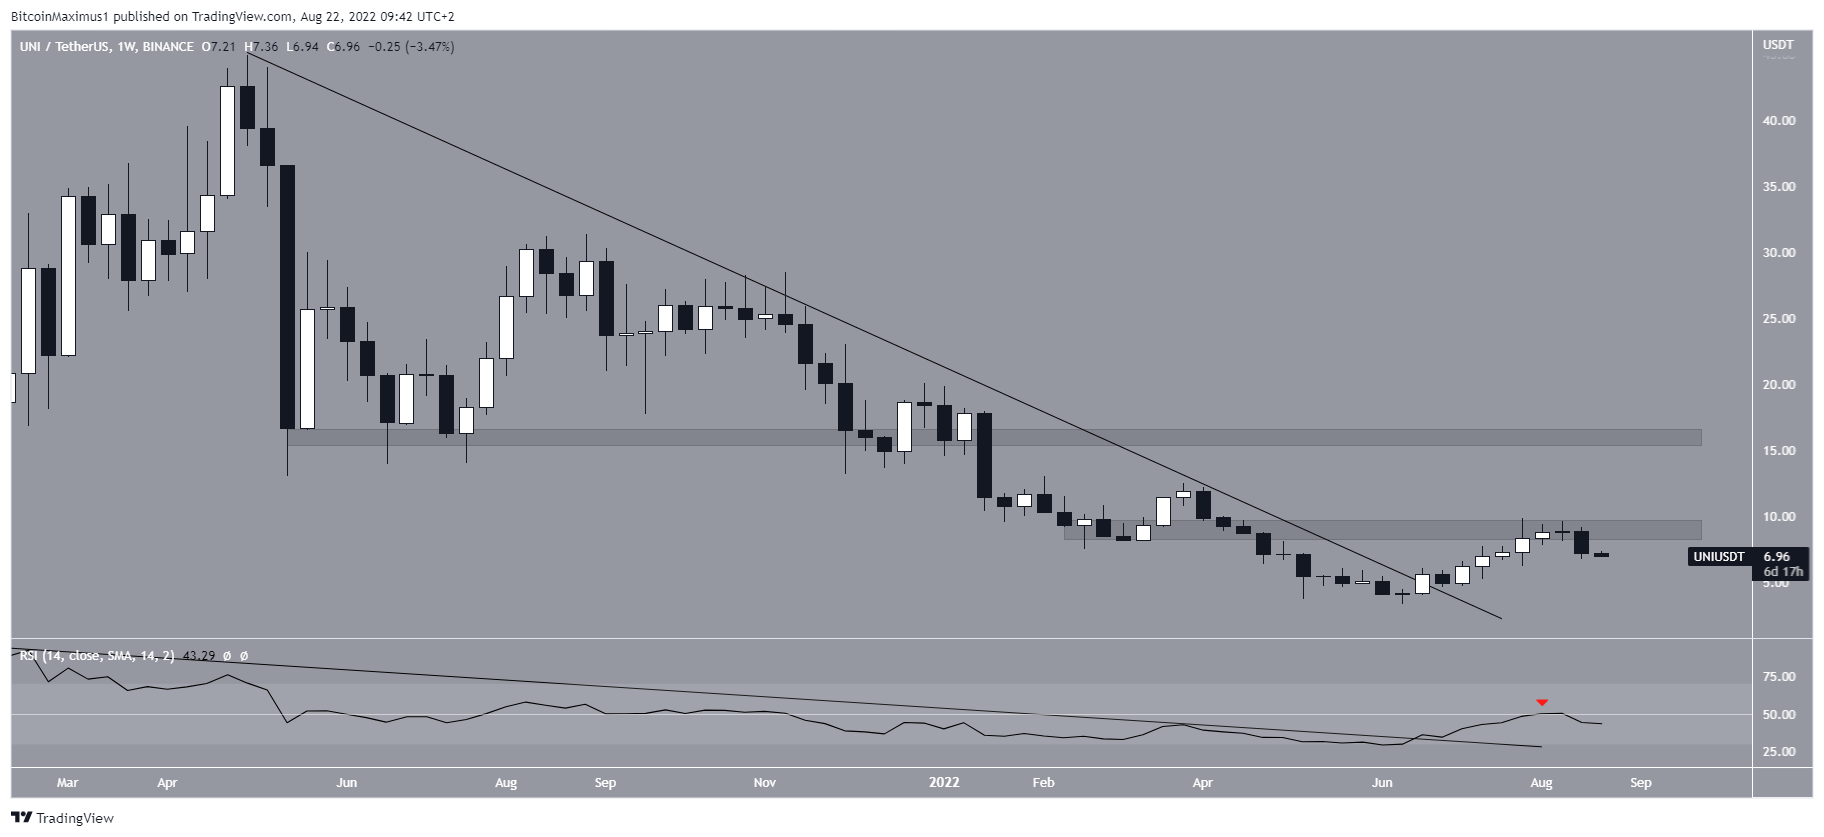
UNI had been decreasing underneath a descending resistance line since reaching an all-time high price of $45 in May 2021. The downward movement led to a low of $3.33 in June. Additionally, the low was combined with an all-time low value in the weekly RSI (green icon).
The price has been increasing since and managed to break out from the line later in June. The upward movement led to a high of $9.83 on July 28.
At the time, the weekly RSI made an attempt at moving above 50. However, the attempt was unsuccessful (red icon).
The closest resistance areas are at $9 and $16. UNI has to break out from the first one alongside an RSI increase above 50 in order for the trend to be considered bullish.
Current UNI pattern
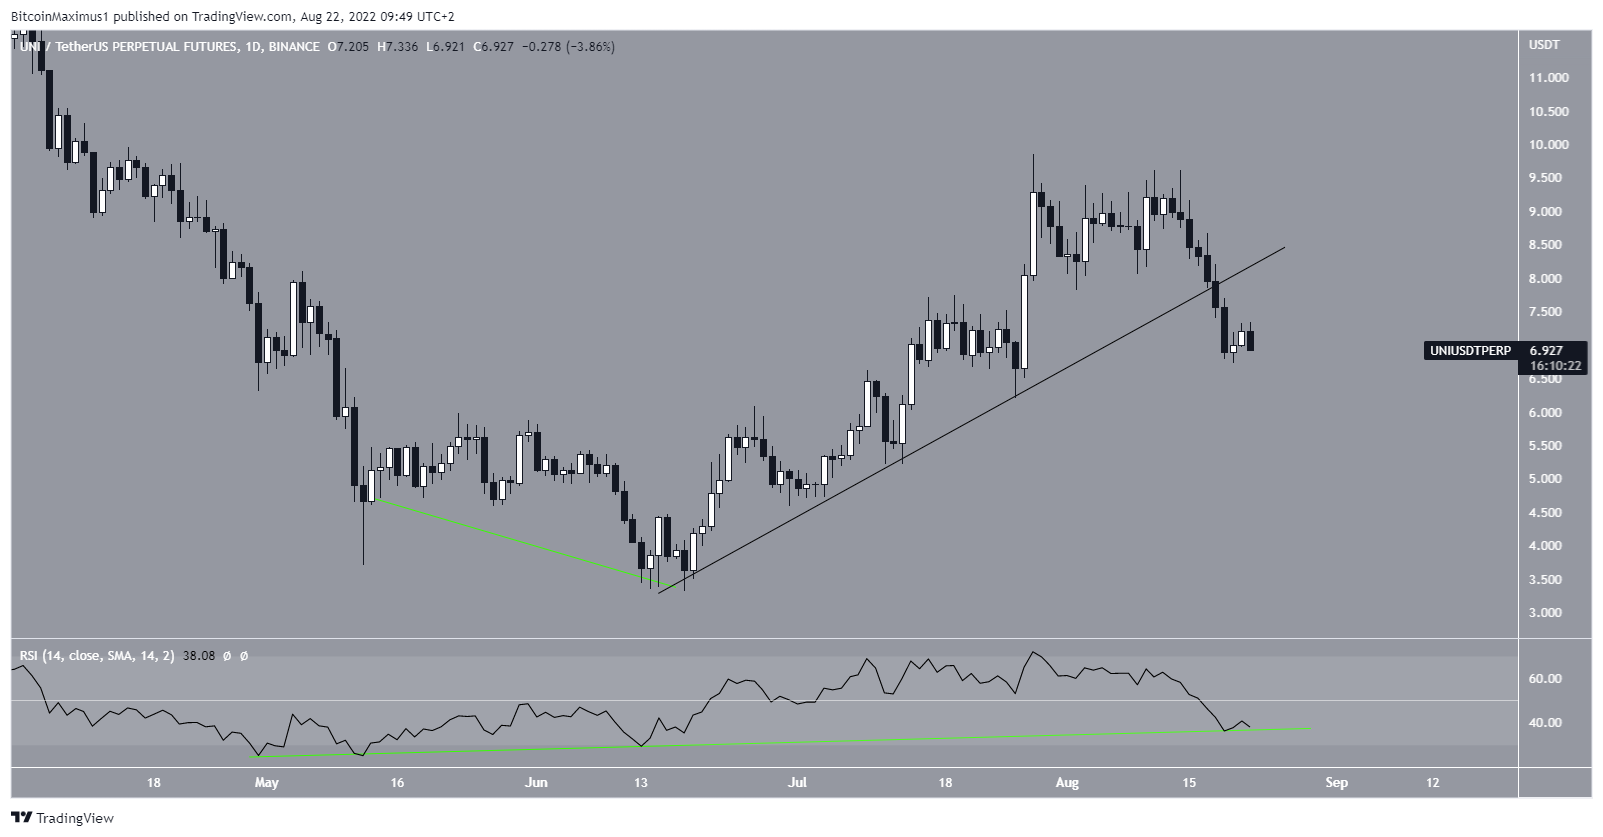
The daily chart provides conflicting signs.
On the bearish side, the price has broken down from an ascending support line. Also, the daily RSI is below 50.
On the bullish side, the bullish divergence trend line in the daily RSI is still intact. This trend line preceded the entire ongoing upward movement.
So, a look at a lower time frame is required in order to determine the direction of the trend.
Wave count analysis
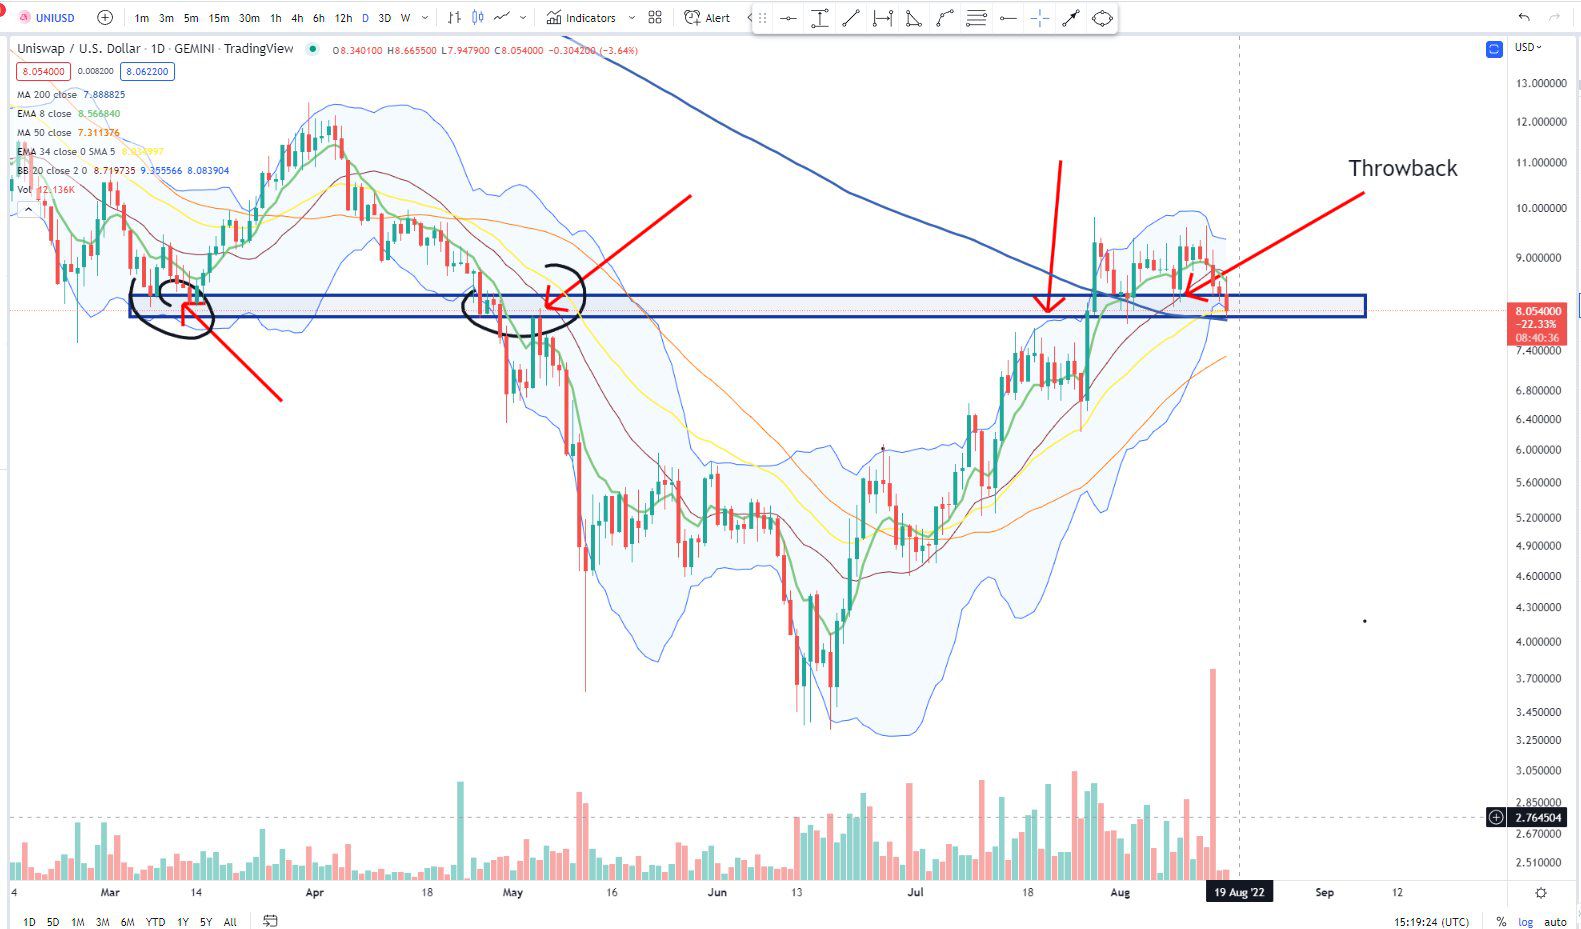
Author and analyst @BigCheds tweeted a chart of UNI, stating that the price has to hold above the $8 area in order for the bullish trend to remain intact.
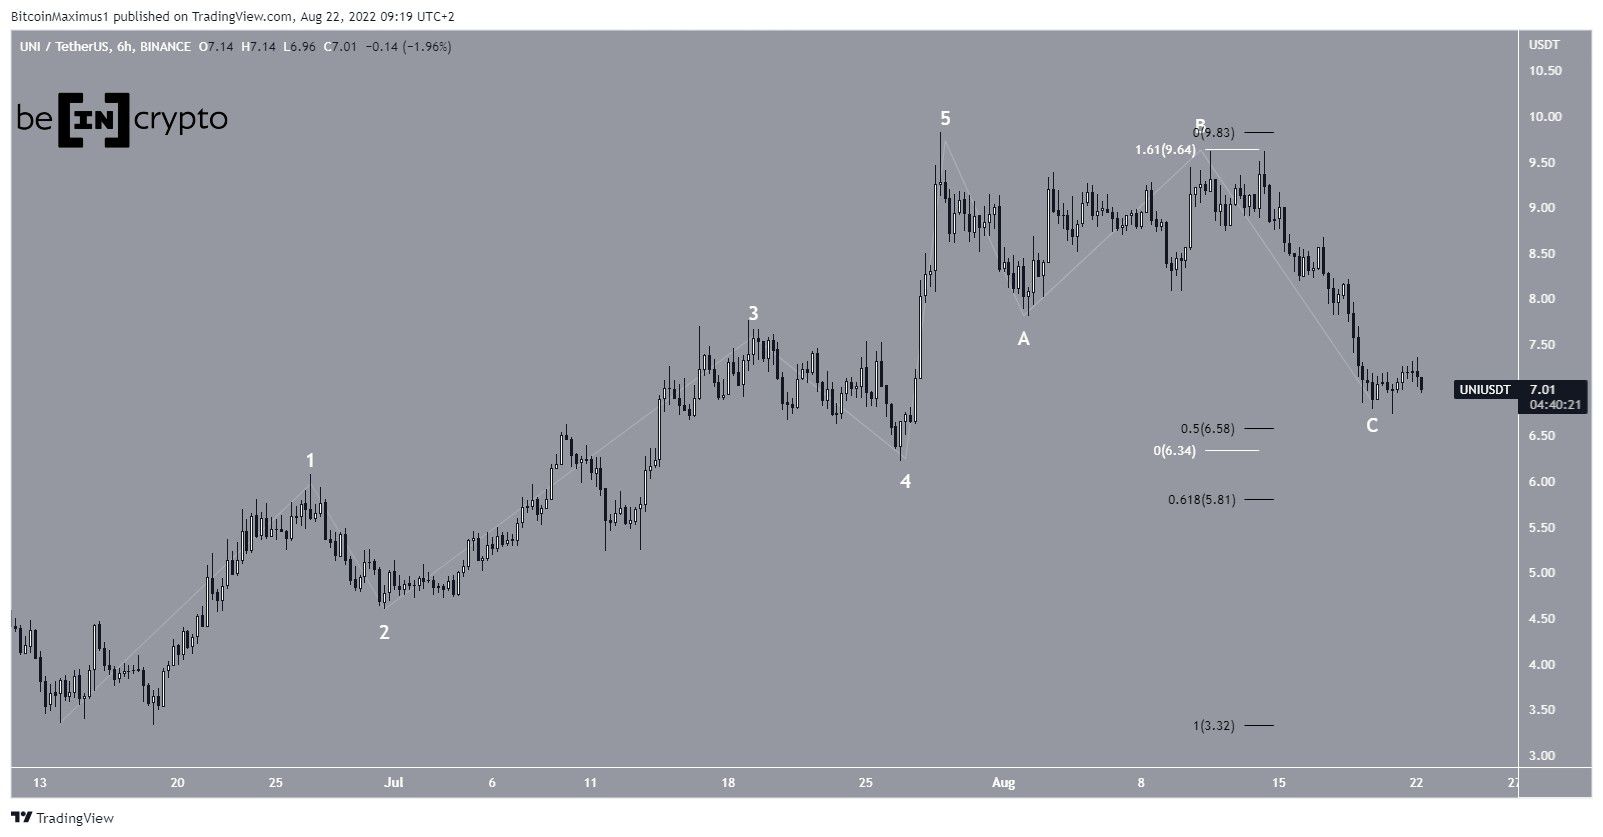
While the price has fallen below the area since, the wave count suggests that since the June lows, UNI has completed a five-wave upward movement that resulted in the $9.83 high.
Since then, it has been mired in an A-B-C corrective structure, in which waves A:C have had close to a 1:1.61 ratio.
The most likely area for a bottom would be between $6.34 and $6.58. This is between the 0.5 Fib retracement support level of the entire upward movement (black) and would give waves A:C an exactly 1:1.61 ratio (white)
For Be[in]Crypto’s latest Bitcoin (BTC) analysis, click here