Highlights:
ETCUSD and ETCBTC are maintaining the same trend after witnessing a huge sell-off. The channel break has positioned both markets in a bearish move.
ETC-USD Market (4H Chart)
Key Levels:
Resistance levels: $4.9, $5.4, $5.9;
Support levels: $3.9, $3.6, $3.3;
After opening short for 2019, Ethereum Classic created the yearly low at $0.36 support; almost close to the 2018 low at $3.2. From there, the crypto-asset took a bullish move and advancing in a rising channel pattern. The buyers were gradually gaining momentum as the strength holds high.
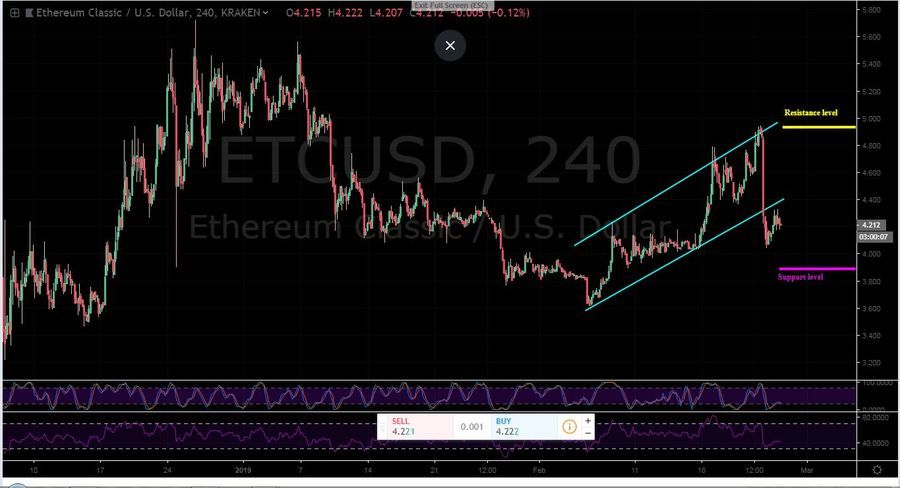
Two days ago, the market experienced an ‘ugly’ scenario as a result of the bears heavy sell-off; breaking the lower trend line. Since then, ETC has been positioned in a decline. The sharp move was reflected on the 4-hours RSI indicator; now facing the oversold region. The closest key support is $3.9.
As it is now, a Medium-term consolidation is up and running. The bears are preparing for another sell which would last to the said support. For the bull, a strong buy entry is needed to surge price to $4.9 resistance level. That seems possible as the 4-hours Stochastic RSI reaches its lowest zone.
ETC-BTC Market
Observing the Bitcoin market, the price action appears to be in a downtrend, following the recent low break scenario owing to Bitcoin’s fall. Most of the top 20 coins suffered a double-drop than the leading global currency. Currently, ETC price is trading at 0.0011 BTC price level.
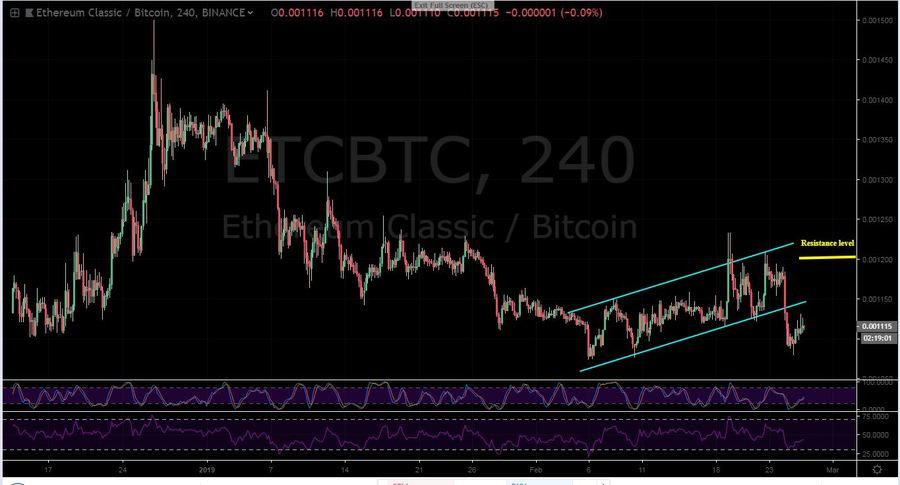
After the break-in, Ethereum Classic has been trending below the ascending channel. A retracement is likely to hits 0.00115 BTC, re-testing the lower trend line. Still, the major resistance level is 0.0012 BTC. See the 4-hours Stochastic RSI aiming high – a sign of buying pressure.
Nevertheless, a bounce down might send price lower if the buyers failed to hold pressure strongly. Looking at the Medium-term RSI indicator, the trend is slowly reaching the oversold line. The dominance seems to remain in bears’ control.