Binance Coin (BNB) is showing bullish signs on both the weekly and daily charts. It is possible that BNB has already reached a long-term bottom.
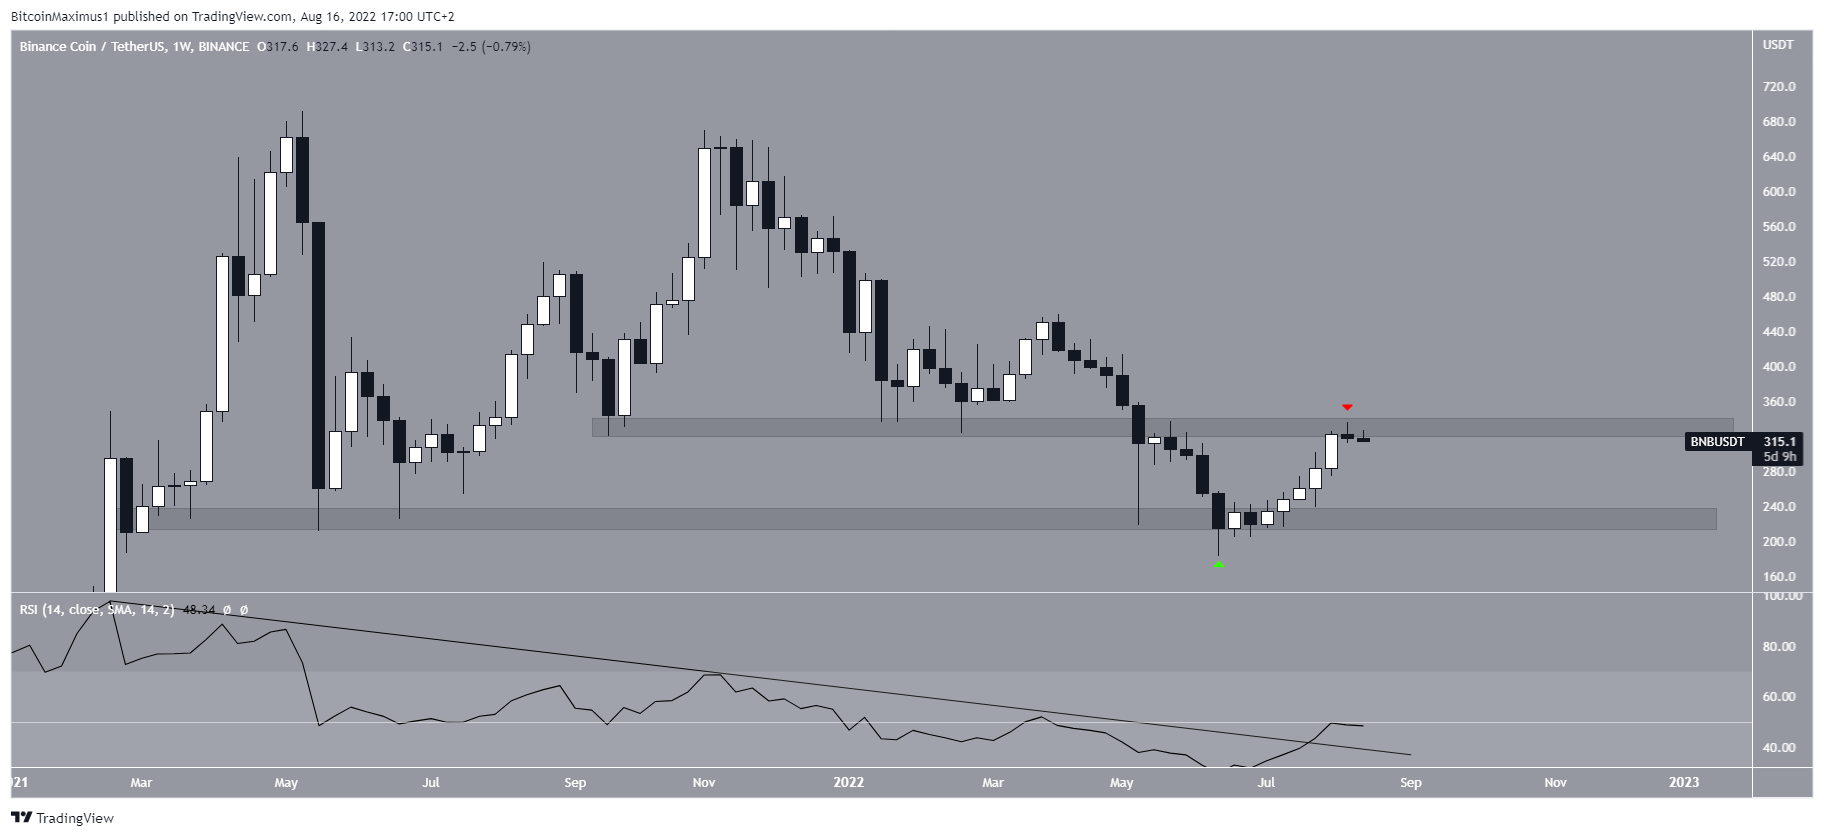
Binance Coin has been mostly falling since reaching an all-time high of $691.80 in May 2021. It created a lower high in November 2021 and resumed its descent towards its June 2022 low of $183.
The price has been increasing since then, in a move that validated the $225 area as support (green icon).
So far, BNB has reached a local high of $336.80. Initially, this caused a rejection from the $335 area (red icon), which had previously provided support. Now, it is likely that the area has turned to resistance.
Interestingly, the weekly RSI has broken out from its descending resistance line that has been in place since the all-time high. Such breakouts often precede price spikes.
Therefore, it is possible that the price will break out above the $335 level and accelerate after.
Ongoing breakout
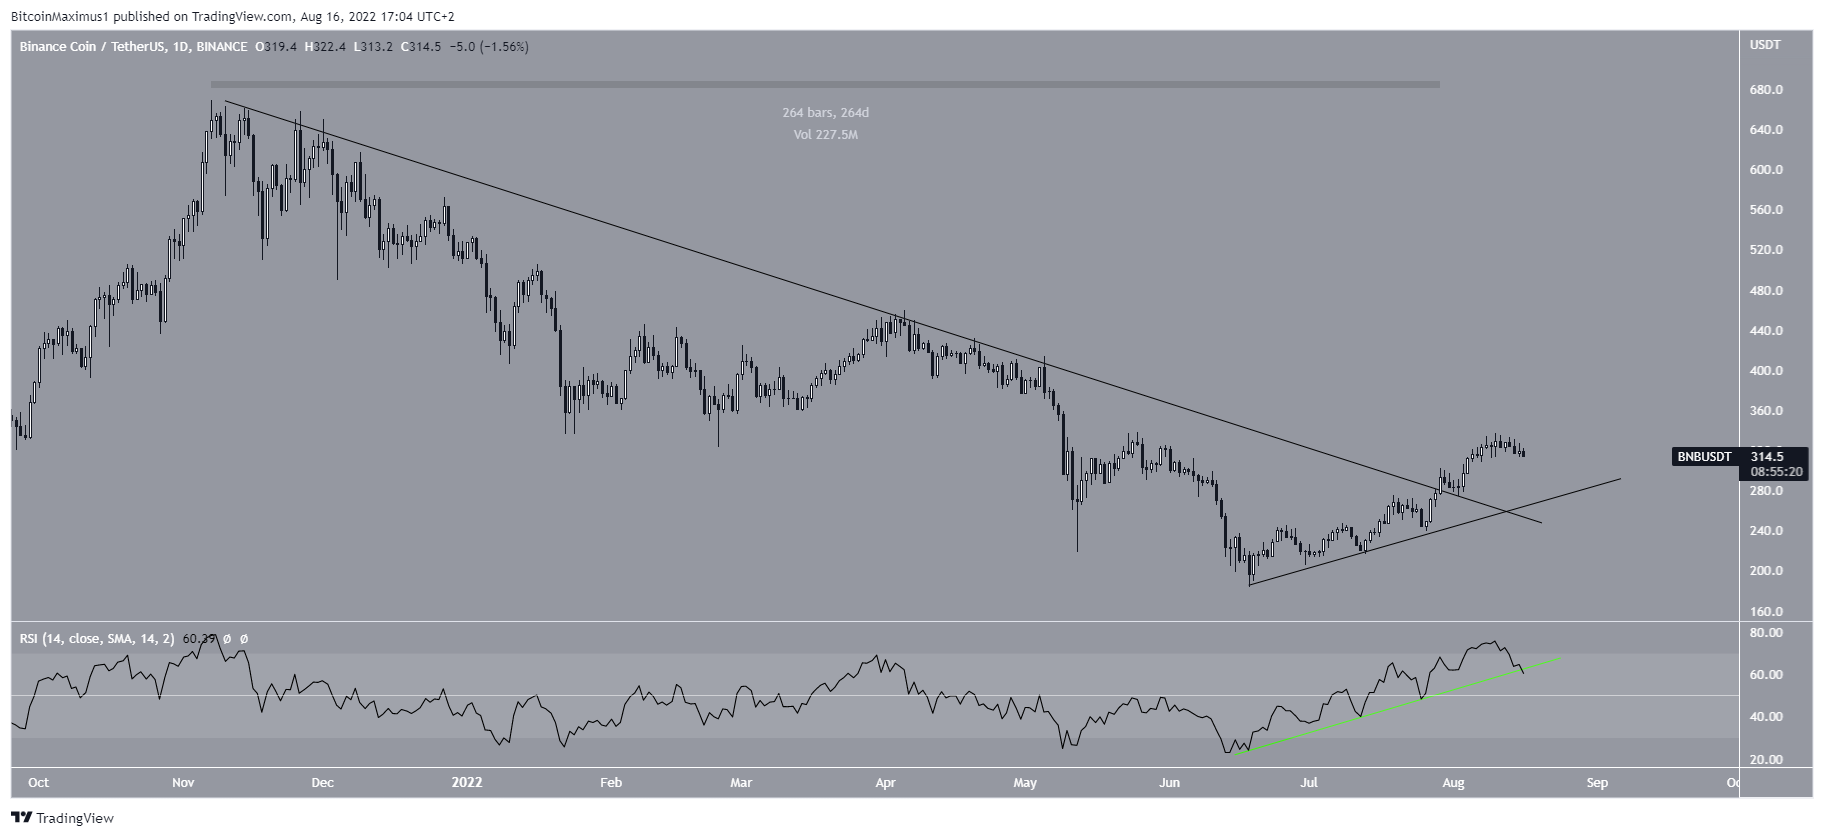
The daily chart also shows a bullish outlook, aligning with the readings from the weekly chart. On July 29, BNB broke out from a descending resistance line that had been in place for 264 days. However, the ascending trendline of the RSI (green line) that accompanied the breakout has now been broken.
As a result, it is possible that the price will decrease towards the ascending support line that has been in place since June 18. The line is currently found at $275. After this, the upward move would be expected to continue.
BNB wave count analysis
Cryptocurrency trader @XForceGlobal tweeted a BNB chart, stating that the price has likely begun a long-term wave five which could eventually take it to a new all-time high price.
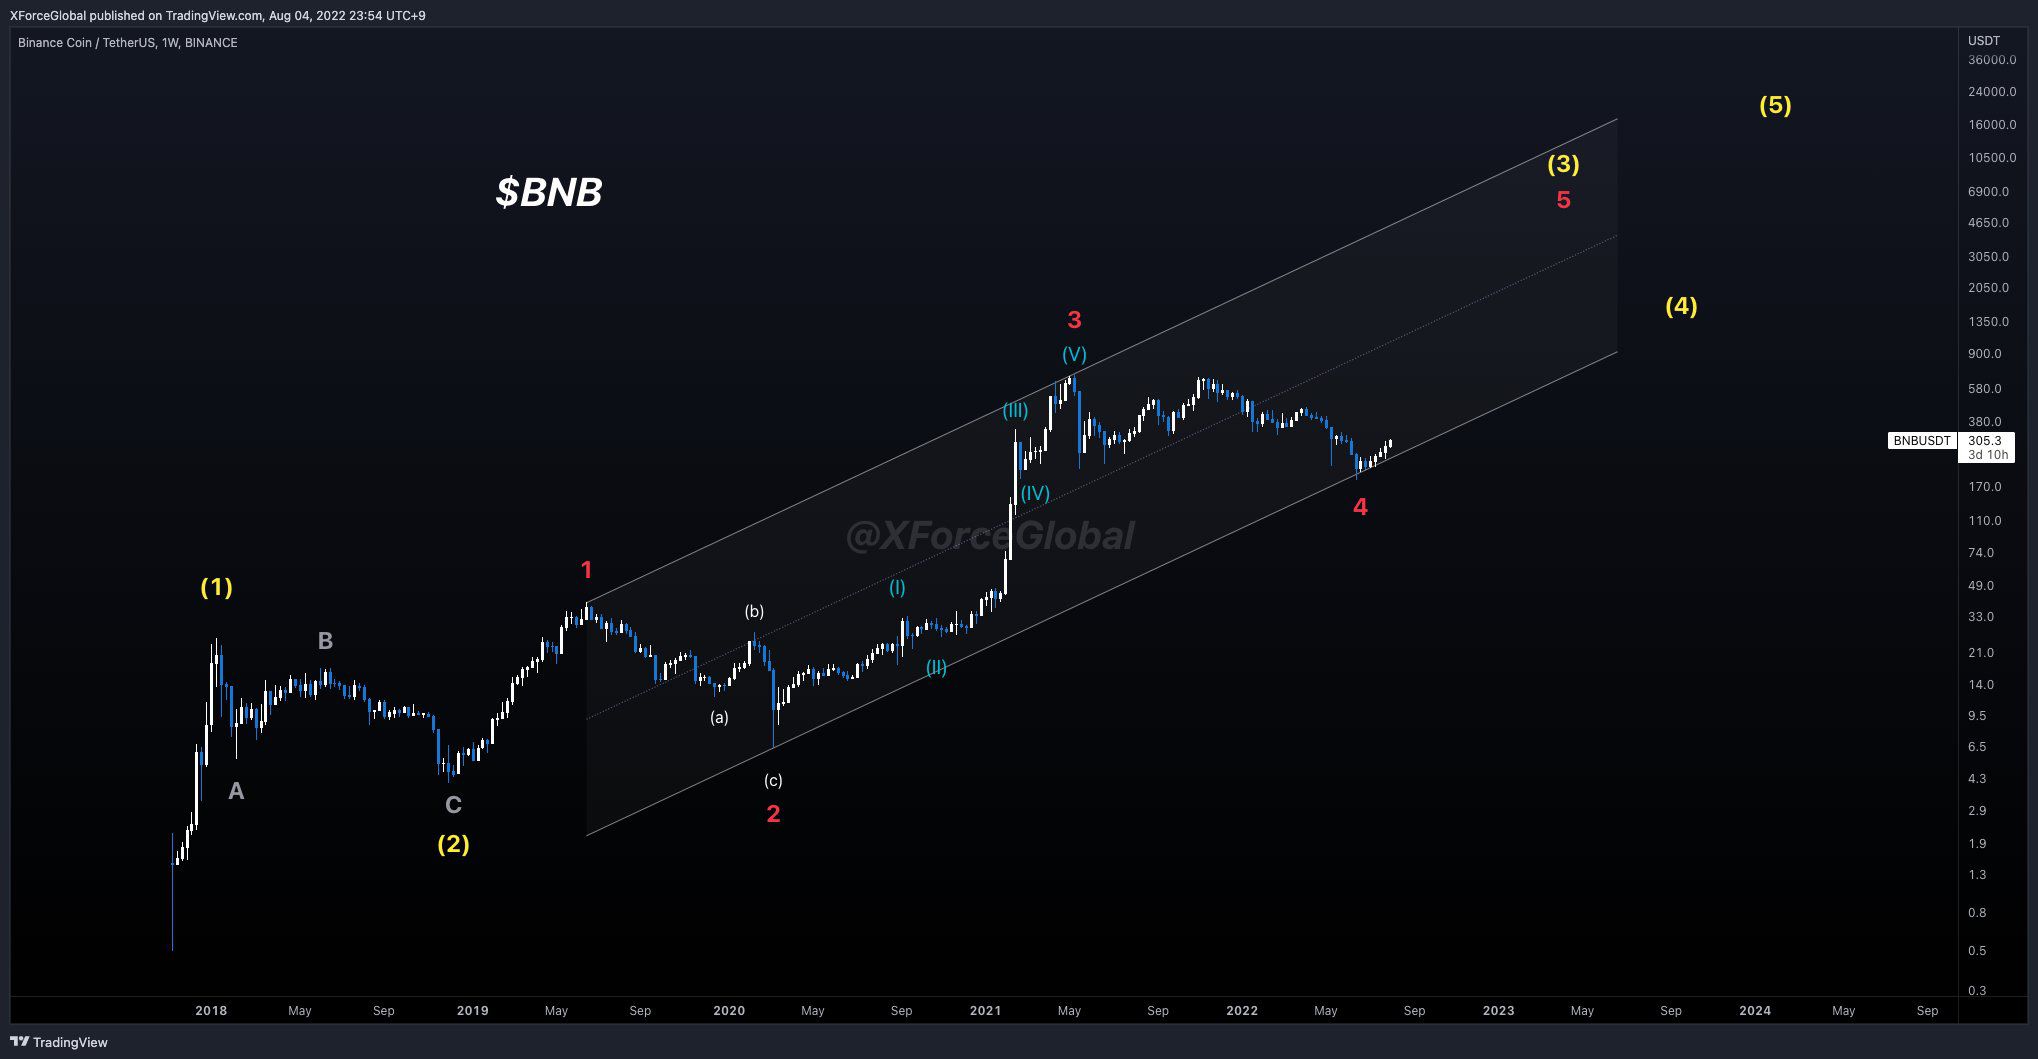
The most likely long-term count indicates that BNB has just begun the fifth and final wave of an impulse that began in December 2018.
There are two main reasons for this being the most likely wave count:
- The bottom of wave four occurred right at a parallel channel that connects the highs of waves one and three and is projected to the bottom of wave two.
- The decrease since the all-time high is an A-B-C structure (white). In it, waves A and C have an exact 1:1 ratio.
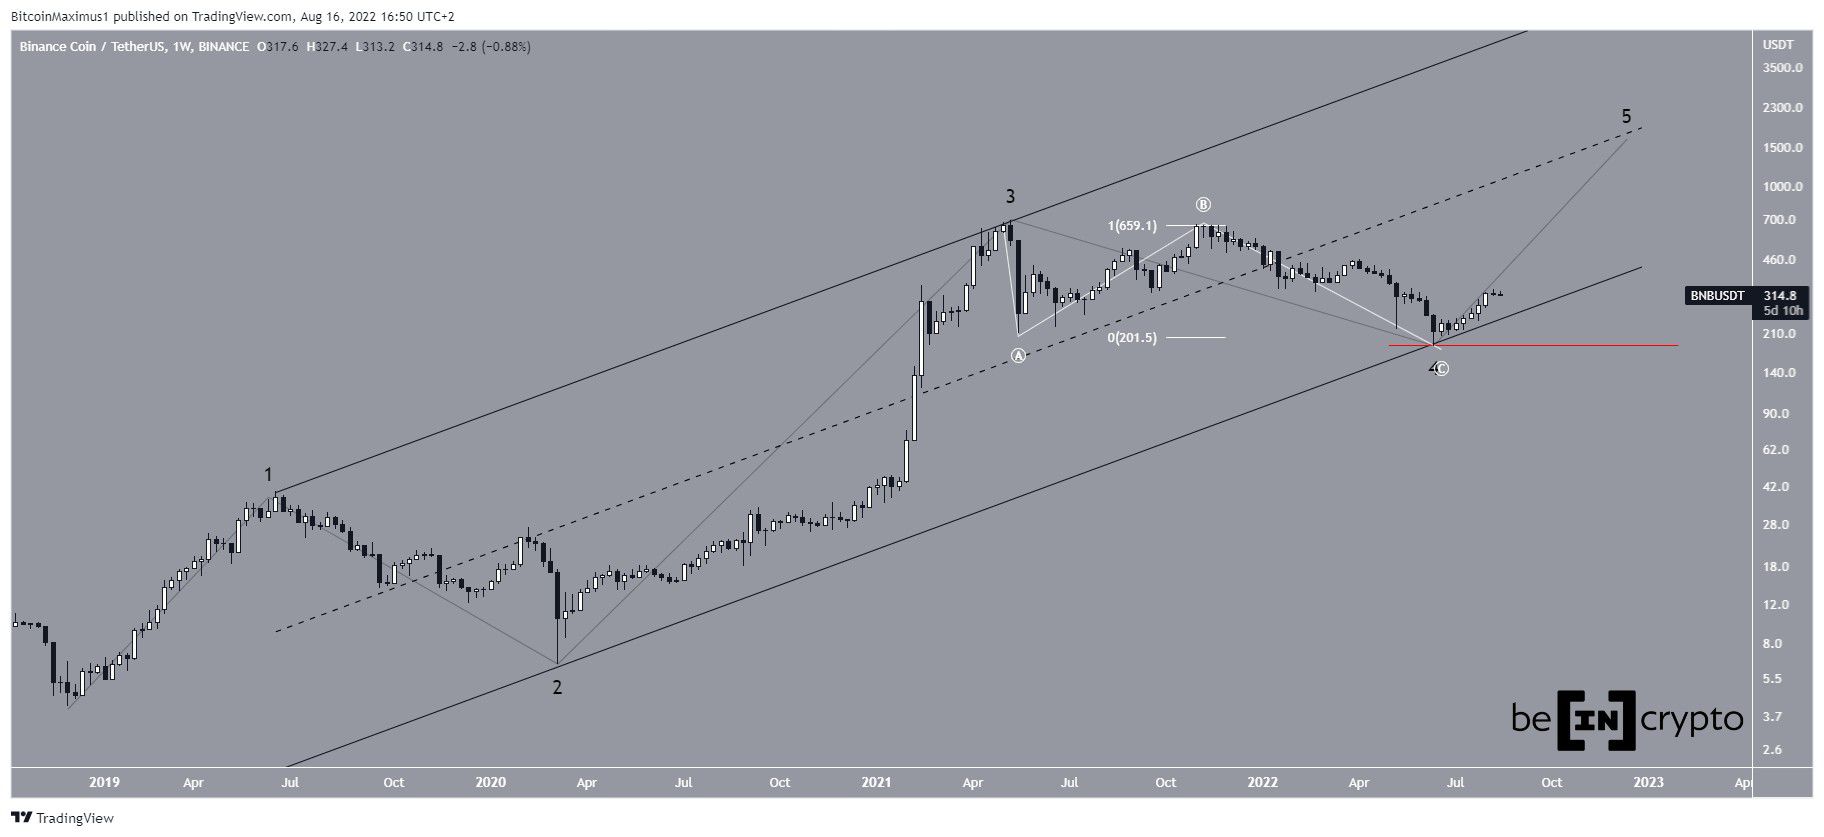
So, if this is the correct count, BNB could potentially increase to a new all-time high. A tentative target for the top of this movement is found in the middle of the same channel which is currently around $2,000.
A decrease below the wave four low of $183 (red) would invalidate this particular wave count.
For Be[in]Crypto’s latest Bitcoin (BTC) analysis, click here