The EOS price action shows the ascending triangle breakout rally crossing above $1.50. But will this rally break the 200-day SMA to reach the $2 mark?
Key Technical Points:
- The token price has increased 30% in the last two days.
- The bull run struggles to rise above the 200-day SMA due to higher price rejection at $1.70.
- With a market cap of $1.627 billion, the intraday trading volume of EOS has increased by 217% to reach $700 million.
Past Performance of EOS
As we mentioned in our previous analysis, the EOS price broke about the $1.40 resistance level resulting in an ascending triangle breakout. The triangle breakout comes after the bullish reversal from the support trendline accounting for a price jump of 30% over the last two days. Furthermore, the breakout rally extends about the $1.50 mark to challenge the overhead assistance of the 200-day SMA. 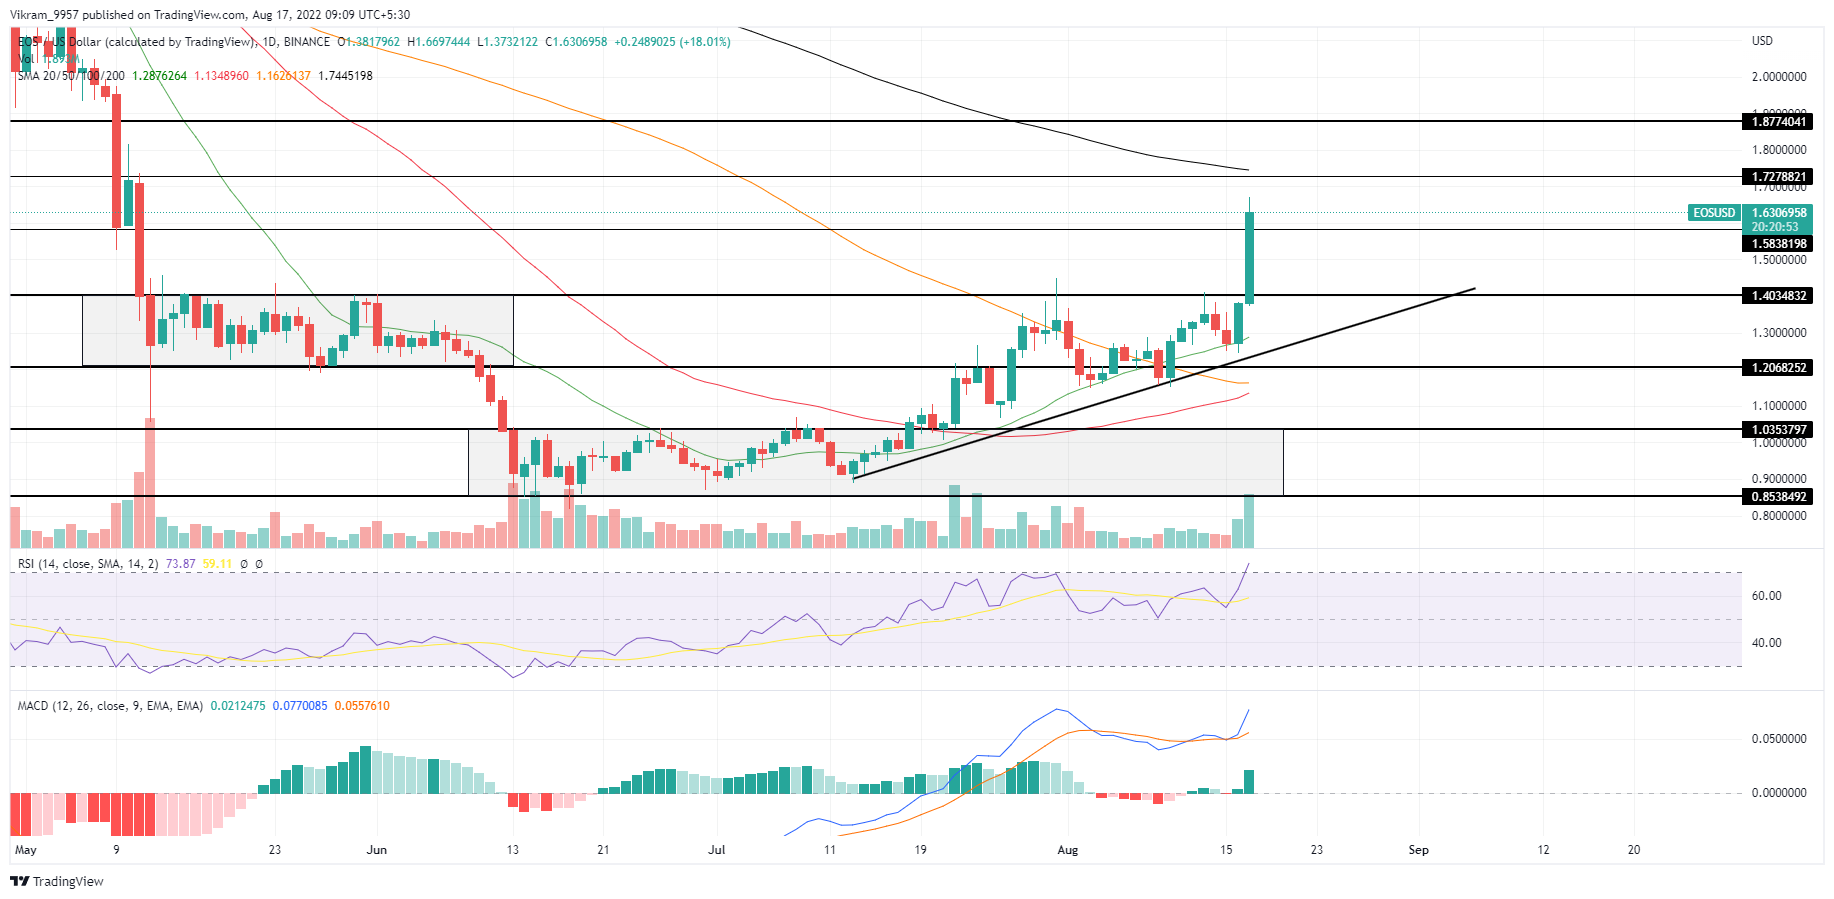 Source - Tradingview
EOS Technical Analysis
The EOS price displays higher price rejection in the daily candle, reflecting the bullish struggle to sustain above the $1.60 mark. However, if the closing prices sustain above the $1.60 mark, the uptrend continuation will exceed the 200-day SMA. The increasing possibility of a bullish crossover between the 50 and 100-day SMA fuels the uptrend momentum. The daily RSI slope extends into the overbought boundary with the recent spike in the underlying bullishness. Moreover, the MACD indicator displays a sharp increase in the bullish gap between the fast and slow lines, reflecting an increase in buying pressure. In a nutshell, the EOS technical analysis projects a high likelihood of an uptrend continuation if the buyers undermine the higher price rejection.
Upcoming Trend
The prolonged uptrend in the EOS prices might extend about the 200-day SMA if the market price sustains above $1.60. Furthermore, traders can expect the uptrend to reach the psychological mark of $2 if the 200-day SMA falls. On the contrary, the fallout below the $1.50 mark will test the $1.40 broken support level. Resistance Levels: $1.70 and $2 Support Levels: $1.60 and $1.50