XRP, like every other cryptocurrency, suffered a massive correction after the bull surge. At press time, XRP was trading at $0.3061 with a market cap of $12.5 billion.
The 24-hour price change showed a massive drop of 10.19%, while the 24-hour trade volume was at $1 billion, which was contributed to by BitMEX exchange via BTC/USD derivatives.
1 Hour
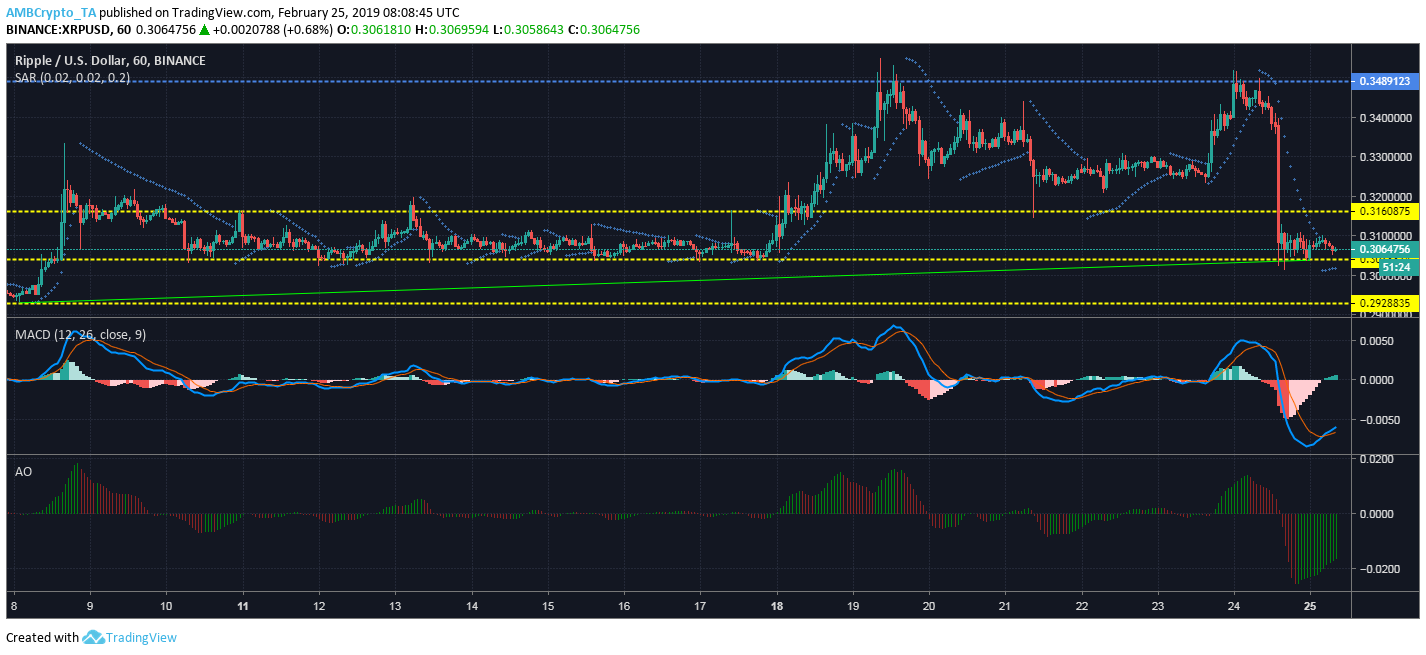
Source: TradingView
While the uptrend in the one-hour chart extended from $0.293 to $0.3037, there was no downtrend formation yet. The support lines that were broken in mid-February are valid again as the prices have fallen below them. The prices were supported at $0.3160 and $0.3038. The lowest support was at $0.2928. The rally ended after it came into contact with the resistance at $0.3489.
The Parabolic SAR markers indicated a bullish trend as they formed below the price candles. It also indicated a reversal in trend for the short term.
The MACD indicator in the one-hour time frame indicated a bullish crossover to the top, suggesting that the rally downwards ended.
The Awesome Oscillator indicated green candles of decreasing height, suggesting decreased momentum for the downtrend.
1 Day
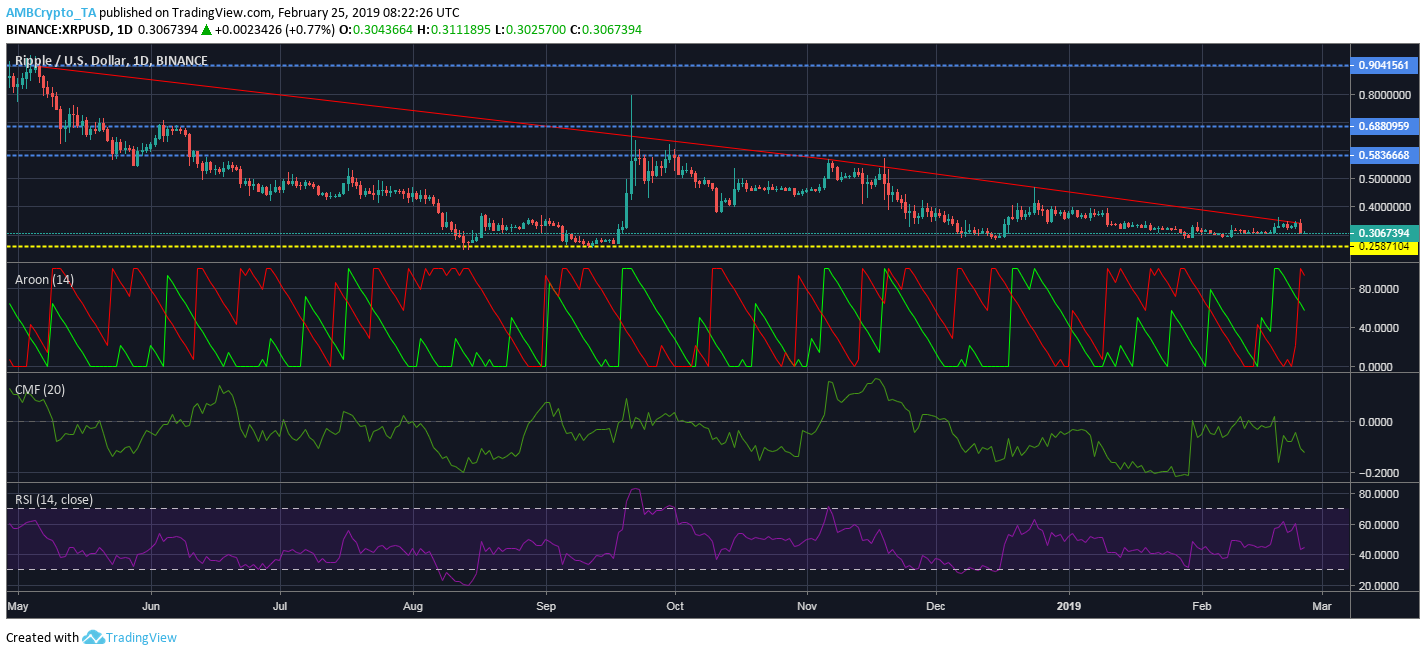
Source: TradingView
The one-day chart indicated a strong downtrend that extended from $0.9027 to $0.3419. The support at $0.2587 was holding steady, while the resistance points at $0.5836, $0.6880, and $0.9027 were far from being tested, considering the price action.
The Aroon indicator showed a strong downtrend in possession of the XRP price action as the Aroon red line peaked at the 100-line.
The Chaikin Money Flow indicated a strong flow of money out of the XRP markets.
The Relative Strength Index indicated a momentum shift in the favour of the sellers as the RSI line was near the 40-line.
Conclusion
The one-hour chart indicated a decrease in the downtrend; possibly a reversal to the upside, which was confirmed by AO, MACD, and SAR indicators. The Aroon, CMF, and RSI indicators suggested that a bearish trend was overtaking XRP prices in the long-term.